Trading Update: Monday November 20, 2023 S&P Emini pre-open market analysis Emini daily chart Emini 5-minute chart and what to expect today Emini intraday market update Friday’s Emini setups Al created the SP500 Emini charts. Here are reasonable stop entry setups from Friday. I show each buy entry bar with a green arrow and each […]
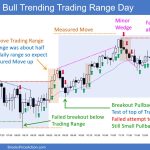
Emini Strong Bulls
Market Overview: S&P 500 Emini Futures The Emini Strong Bulls formed 3 consecutive bull bars closing near their highs, breaking far above the 20-week EMA and the bear trend line on the weekly chart. They want a resumption of the bull trend. The bears hope to get a reversal from a lower high major trend […]
Crude Oil Trend Channel Line Overshoot
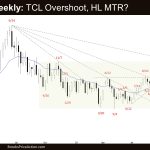
Market Overview: Crude Oil Futures The market formed a Crude Oil trend channel line overshoot, closing as a bear doji with a long tail below. The bulls hope to get a reversal from a higher low major trend reversal. The bears hope that the bear leg to retest the May low has begun. Crude oil […]
EURUSD Bulls Need Follow-through
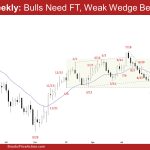
Market Overview: EURUSD Forex The EURUSD bulls need follow-through buying to increase the odds of a retest and breakout attempt above the trading range high. The bears hope that the current move is simply a deep pullback and want a reversal from a wedge bear flag or a lower high major trend reversal. EURUSD Forex […]
Bitcoin caution right below 40000 Sell Zone
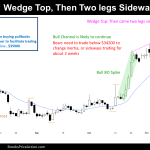
Market Overview: Bitcoin Futures Bitcoin right below 40000’s sell zone. During the week the price decreased it is value but still, it closed above the mid-point of the weekly range. The prior 3-week’s low are all nearby, trading below that might change the inertia in favor of the bears. Moreover, the price is near a […]
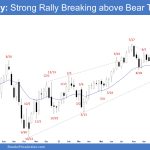
Nasdaq 100 Market Back near July 2023 High
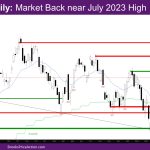
Market Overview: NASDAQ 100 Emini Futures The NASDAQ Emini futures week is more follow-through to the bull bar of 10/30. The market is back near July 2023 high. On the daily chart, this week gapped up above the lower high of 9/14. The monthly bar is a strong bull trend bar with a close above […]
Nifty 50 Trading Range
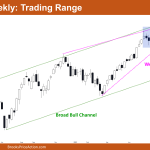
Market Overview: Nifty 50 Futures Nifty 50 Trading Range on the weekly chart. The market on the weekly chart gave a weak bull close (due to the tail at the top) this week. After a failed bear breakout attempt that received no follow-through, the market has once again entered the trading range. Bears have also […]
DAX 40 Bull Breakout and FT, Testing TTR
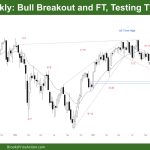
Market Overview: DAX 40 Futures DAX futures rocketed higher last week with a bull breakout, 5 bull days reaching a measured move target. It was 3 pushes down, a wedge bottom and a test of the swing low in a trading range. A type of double-bottom buy setup. But the failed sell signals on the […]
FTSE 100 High 2, Bull Breakout of Inside Bar
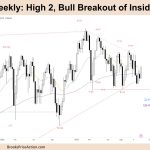
Market Overview: FTSE 100 Futures FTSE 100 futures moved higher last week with a bull breakout of an inside bar, a High 2. It is still BOM on the weekly chart, but the daily bulls are getting buy signals. After getting another always-in-short signal, the bears want the price to fail at the MA and […]
Emini High 1 Buy Signal Yesterday
Trading Update: Friday November 17, 2023 S&P Emini pre-open market analysis Emini daily chart Emini 5-minute chart and what to expect today Yesterday’s Emini setups Al created the SP500 Emini charts. Here are reasonable stop entry setups from yesterday. I show each buy entry bar with a green arrow and each sell entry bar with […]

