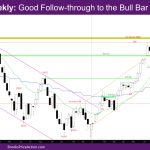
Market Overview: NASDAQ 100 Emini Futures The NASDAQ Emini futures week is a good follow-through to the bull bar of 10/30. On the daily chart, this week closed above the first lower high of 10/12. The monthly bar is a strong bull trend bar already above the October high. The problem for the bulls is […]
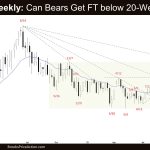
Nifty 50 Failed Breakout
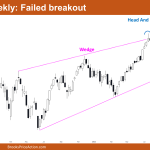
Market Overview: Nifty 50 Futures Nifty 50 Failed Breakout on the weekly chart. This week’s market produced a tiny bull close with a tiny body following two strong bear bars in a row, increasing the likelihood of a second leg down. A bear breakout of the head and shoulders top was also shown on the […]
Emini High 1 Buy Setup Likely
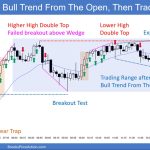
Trading Update: Friday November 10, 2023 S&P Emini pre-open market analysis Emini daily chart Emini 5-minute chart and what to expect today Yesterday’s Emini setups Al created the SP500 Emini charts. Here are reasonable stop entry setups from yesterday. I show each buy entry bar with a green arrow and each sell entry bar with […]
Emini Profit Taking Likely
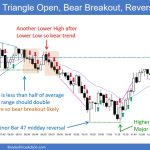
Trading Update: Thursday November 9, 2023 S&P Emini pre-open market analysis Emini daily chart Emini 5-minute chart and what to expect today Emini intraday market update Yesterday’s Emini setups Al created the SP500 Emini charts. Here are reasonable stop entry setups from yesterday. I show each buy entry bar with a green arrow and each […]
Emini likely to Rally above October 17 High
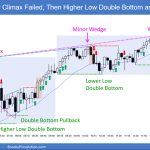
Trading Update: Wednesday November 8, 2023 S&P Emini pre-open market analysis Emini daily chart Emini 5-minute chart and what to expect today Yesterday’s Emini setups Al created the SP500 Emini charts. Here are reasonable stop entry setups from yesterday. I show each buy entry bar with a green arrow and each sell entry bar with […]
Emini Pullback Likely
Trading Update: Tuesday November 7, 2023 S&P Emini pre-open market analysis Emini daily chart Emini 5-minute chart and what to expect today Emini intraday market update Yesterday’s Emini setups Al created the SP500 Emini charts. Here are reasonable stop entry setups from yesterday. I show each buy entry bar with a green arrow and each […]
Emini Approaching 4,400 and October High
Trading Update: Monday November 6, 2023 S&P Emini pre-open market analysis Emini daily chart Emini 5-minute chart and what to expect today Emini intraday market update Friday’s Emini setups Al created the SP500 Emini charts. Here are reasonable stop entry setups from Friday. I show each buy entry bar with a green arrow and each […]
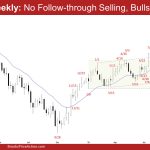
Emini Climactic Reversal
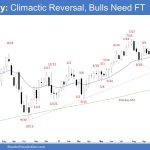
Market Overview: S&P 500 Emini Futures The weekly chart formed an Emini climactic reversal reversing half of the whole move down within a week. The bulls need to create follow-through buying next week to increase the odds of higher prices. The bears hope that this week was simply a 50% pullback and wants a larger […]
Crude Oil Two-Legged Pullback
Market Overview: Crude Oil Futures The weekly chart formed a Crude Oil two-legged pullback, closing below the 20-week EMA. The bears need to create follow-through selling below the 20-week EMA to increase the odds of a reversal lower. The bulls want a reversal up from a double bottom bull flag (Oct 6 and Nov 3). […]
EURUSD Double Bottom Bull Flag
Market Overview: EURUSD Forex The monthly chart could be forming a EURUSD double bottom bull flag (Jan 6 and Oct 3). The bulls want November to be a bull bar closing near its high. The bears will need to create a breakout below the trading range low with follow-selling to increase the odds of a […]

