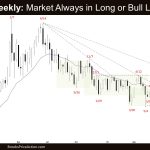
Market Overview: Crude Oil Futures The market formed a Crude Oil tight bull channel with some follow-through following last week’s breakout above the 41-week trading range. The bulls want a strong breakout above the trading range and a measured move based on the height of the 41-week trading range. The bears want a reversal down […]
EURUSD Tight Bear Channel
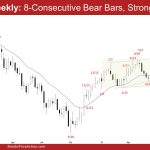
Market Overview: EURUSD Forex The market formed a EURUSD tight bear channel which means strong bears. The market may still trade at least a little lower. If the bears continue to create strong consecutive bear bars trading far below the May and March low, it will increase the odds of the reversal being successful. Because […]
Bitcoin Peril Pointing Towards Right Shoulder Low near 20000
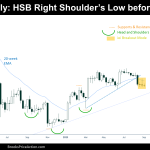
Market Overview: Bitcoin Bitcoin is pointing towards the Right Shoulder Low of the Head and Shoulders Bottom (HSB) pattern on the Weekly Chart. The Bulls could not trend strongly after the Bull Breakout of the HSB, apparently there has not been fuel enough; However, if the price trades at the Right Shoulder Low, it will […]
Nifty 50 Bull Flag
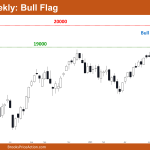
Market Overview: Nifty 50 Futures Nifty 50 Bull Flag on the weekly chart. On the weekly chart, the market formed a strong bull bar following an unsuccessful attempt at a reversal. Bulls gave a bull breakout of the bull flag, and based on the height of the bull flag, this could cause a measured move […]
FTSE 100 Big Triangle at 100-Week MA
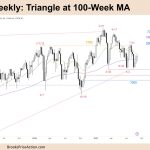
Market Overview: FTSE 100 Futures The FTSE futures market moved higher into the apex of a larger triangle pattern on the weekly chart. It is breakout mode (BOM). Traders can be long or short, but most should be flat right now. Bears want a break below and a MM down. Probably sellers above the doji. Bulls […]
DAX 40 Bear Close Under MA – 2nd Leg Down or Reversal
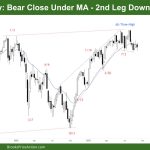
Market Overview: DAX 40 Futures DAX futures moved sideways to down last week with a bear close under the MA but could not get far below just yet. The bulls want this to be a bull flag, and then BO and move back to test the highs. The bears see a HTF trading range, and […]
Nasdaq 100 Second Leg Down from 7/31?
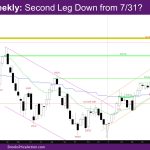
Market Overview: NASDAQ 100 Emini Futures The NASDAQ Emini futures week is a bear inside bar with a tail below. It is possibly the start of the second leg down from 7/31, when the first leg down started. On the daily chart, this week looks like a pullback from the breakout of last week. This […]
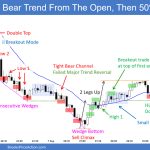
Emini Bulls Want Rally above Yesterday’s High
Trading Update: Friday September 8, 2023 S&P Emini pre-open market analysis Emini daily chart Emini 5-minute chart and what to expect today Yesterday’s Emini setups Richard created the SP500 Emini chart (Al travelling). Chart time is ET+12 hours. Here are several reasonable stop entry setups from yesterday. I show each buy entry with a green […]
Amostra da Enciclopédia Brooks de Padrões Gráficos
Configurações de padrões de Swing Trade para day traders A Enciclopédia Brooks de Padrões Gráficos é o que Al Brooks utiliza em sua sala ao vivo para mostrar aos traders o que podem esperar conforme o padrão vai se formando. O conjunto completo de mais de 8,000 slides está disponível online para compra apenas para “Membros […]
Emini Closed August 24th Breakout Point
Trading Update: Thursday September 7, 2023 S&P Emini pre-open market analysis Emini daily chart Emini 5-minute chart and what to expect today Emini intraday market update Yesterday’s Emini setups Richard created the SP500 Emini charts (Al travelling). Chart time is ET+12 hours. Here are several reasonable stop entry setups from yesterday. I show each buy […]

