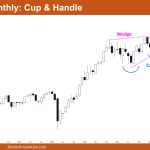
Market Overview: Nifty 50 Futures Nifty 50 Cup & Handle on the monthly chart. On the monthly chart, the market showed a bull breakout of the cup and handle pattern in the month of July, but since the market did not produce a strong follow-through bar this month, the likelihood of a failed bull breakout […]
Emini Buyers below Yesterday’s Reversal Bar
Trading Update: Friday September 1, 2023 S&P Emini pre-open market analysis Emini daily chart Emini 5-minute chart and what to expect today Yesterday’s Emini setups Al created the SP500 Emini chart. Here are several reasonable stop entry setups from yesterday. I show each buy entry with a green rectangle and each sell entry with a […]
Emini Follow-Through Buying
Trading Update: Thursday August 31, 2023 S&P Emini pre-open market analysis Emini daily chart Emini 5-minute chart and what to expect today Yesterday’s Emini setups Al created the SP500 Emini charts. Here are several reasonable stop entry setups from yesterday. I show each buy entry with a green rectangle and each sell entry with a […]
Emini Bulls Want Measured Move Up
Trading Update: Wednesday August 30, 2023 S&P Emini pre-open market analysis Emini daily chart Emini 5-minute chart and what to expect today Emini intraday market update Yesterday’s Emini setups Al created the SP500 Emini charts. Here are several reasonable stop entry setups from yesterday. I show each buy entry with a green rectangle and each […]
Emini Bulls Need More Signs of Strength
Trading Update: Tuesday August 29, 2023 S&P Emini pre-open market analysis Emini daily chart Emini 5-minute chart and what to expect today Emini intraday market update Yesterday’s Emini setups Al created the SP500 Emini charts. Here are several reasonable stop entry setups from yesterday. I show each buy entry with a green rectangle and each […]
Emini Bears Second Leg Down
Trading Update: Monday August 28, 2023 S&P Emini pre-open market analysis Emini daily chart Emini 5-minute chart and what to expect today Emini intraday market update Friday’s Emini setups Al created the SP500 Emini charts. Here are several reasonable stop entry setups from Friday. I show each buy entry with a green rectangle and each […]
Crude Oil Weak Follow-through
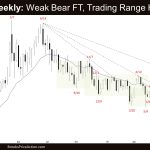
Market Overview: Crude Oil Futures The weekly chart formed a Crude Oil weak follow-through bear bar. The bulls want a retest and breakout above the August 10 high. The bears want the start of the bear leg to retest the 40-week trading range low. The market is in a 40-week trading range. Traders will BLSH […]
EURUSD Consecutive Closes below 20-Week EMA
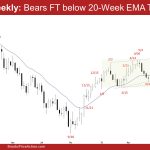
Market Overview: EURUSD Forex The weekly chart was a EURUSD consecutive closes below the 20-week EMA, testing the bull trend line. While the odds continue to favor the market to trade at least a little lower, a minor pullback can begin within a few weeks. Odds favor a second leg sideways to down after a […]
Bitcoin at 26k Bear Continuation or Failure
Market Overview: Bitcoin Futures Bitcoin traded sideways during the week and Traders are wondering if there will be a Bear Continuation of the past week’s bear breakout, or if Bears will fail. Bitcoin futures The Weekly chart of Bitcoin futures Past (Supports & Resistances) “Every market probes up and down to discover how far is […]
Emini Breakout Mode, Minor PB or Another Leg Down?
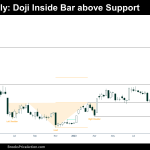
Market Overview: S&P 500 Emini Futures The weekly candlestick formed was an inside bull doji, forming an Emini breakout mode. The bulls want a breakout above, while the bears want a breakout below the inside bar. For now, odds slightly favor the current sideways to down pullback to be minor and at least a small […]

