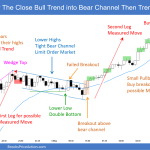
Trading Update: Monday May 8, 2023 S&P Emini pre-open market analysis Emini daily chart Emini 5-minute chart and what to expect today Emini intraday market update Friday’s Emini setups Richard created the SP500 Emini charts (Al on leave). Here are several reasonable stop entry setups from Friday. I show each buy entry with a green […]
Emini Double Bottom at 20-Week EMA
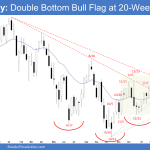
Market Overview: S&P 500 Emini Futures The S&P 500 Emini futures formed an Emini double bottom at the 20-week exponential moving average. So far, the pullback in the Emini has gone sideways. The bears are not yet strong. The bulls want a strong breakout above February 2 high followed by a measured move up using […]
Crude Oil Failed Bear BO, Possible Small Second Leg Down
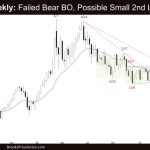
Market Overview: Crude Oil Futures The Crude Oil futures moved lower last week, but it was a failed Bear BO (breakout). Price rebounded strongly and finished with consecutive bull bars by Friday on the daily chart and a bad bear close on the weekly. After breaking a trend line, the bulls are setting up a […]
EURUSD Pullback after Bull Micro Channel
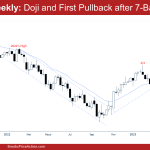
Market Overview: EURUSD Forex EURUSD pullback after bull micro channel finally formed on the weekly chart after 7 bars. As stated during the prior report, odds favored buyers below the first pullback below such a strong bull micro channel. The bulls think that the bullish inertia is strong enough to close the gap between the price […]
Bitcoin Breakout Mode
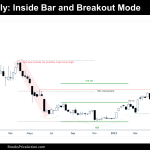
Market Overview: Bitcoin Futures Bitcoin breakout mode and inside bar on weekly chart. The price increased its value by +0.71% during the week. Traders wonder if this is the beginning of a small pullback bull trend or if a bear leg and test down to the 2022 low is about to start. Bitcoin futures The Weekly […]
FTSE Head and Shoulders Top or High 1 Buy?
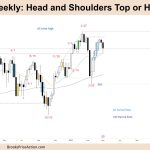
Market Overview: FTSE 100 Futures The FTSE futures market formed a possible FTSE head and shoulders top on the weekly chart. The bulls want a High 1 buy above the pullback, but they might wait for a better entry bar. The bulls want a strong close or double bottom above the prior trading range high from […]
Nasdaq Minimum Follow-through Bar on Weekly Chart
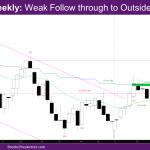
Market Overview: NASDAQ 100 Emini Futures NASDAQ Emini futures market ended week with minimum follow-through bar to the outside bar last week. Closed as a doji bar with a long tail below, closing just below last week’s close. The market has been essentially sideways for the past 5 weeks. There are still bull targets above, […]
Nifty 50 Tight Bull Channel
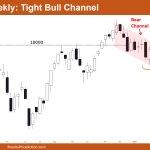
Market Overview: Nifty 50 Futures Nifty 50 tight bull channel on the weekly chart. Bulls were unable to create a strong follow-through above the big round number 18000, and bears on the weekly chart will stay away from selling until the market develops another strong bear bar. This week, the market formed a bear bar that […]
DAX 40 Outside-Outside, Expanding Triangle in Bull Channel
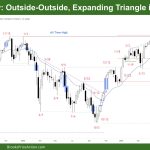
Market Overview: DAX 40 Futures DAX futures was a OO, a Dax 40 Outside-Outside bar setup and expanding triangle high in a bull channel. The bulls want a break above and push to the all-time high (ATH) and their measured move target above. The bears want the bull BO to fail and reverse strongly back […]
Emini Buyers Likely below April 26 Low
Trading Update: Friday May 5, 2023 S&P Emini pre-open market analysis Emini daily chart Emini 5-minute chart and what to expect today Emini intraday market update Yesterday’s Emini setups Al created the SP500 Emini chart. Here are several reasonable stop entry setups from yesterday. I show each buy entry with a green rectangle and each […]

