Trading Update: Thursday May 4, 2023 S&P Emini pre-open market analysis Emini daily chart Emini 5-minute chart and what to expect today Emini intraday market update Yesterday’s Emini setups Al created the SP500 Emini charts. Here are several reasonable stop entry setups from yesterday. I show each buy entry with a green rectangle and each […]
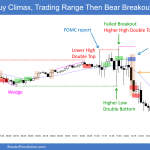
Emini Sideways into FOMC Report Today
Trading Update: Wednesday May 3, 2023 S&P Emini pre-open market analysis Emini daily chart Emini 5-minute chart and what to expect today Emini intraday market update Yesterday’s Emini setups Al created the SP500 Emini charts. Here are several reasonable stop entry setups from yesterday. I show each buy entry with a green rectangle and each […]
Emini Probable Second Leg Up after Last Week’s Rally
Trading Update: Tuesday May 2, 2023 S&P Emini pre-open market analysis Emini daily chart Emini 5-minute chart and what to expect today Yesterday’s Emini setups Al created the SP500 Emini charts. Here are several reasonable stop entry setups from yesterday. I show each buy entry with a green rectangle and each sell entry with a […]
Emini First Reversal Down Likely to Fail
Trading Update: Monday May 1, 2023 S&P Emini pre-open market analysis Emini daily chart Emini 5-minute chart and what to expect today Emini intraday market update Friday’s Emini setups Al created the SP500 Emini charts. Here are several reasonable stop entry setups from Friday. I show each buy entry with a green rectangle and each […]
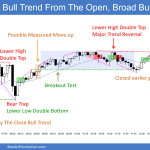
Emini Consecutive Bull Bars Close above EMA
Market Overview: S&P 500 Emini Futures S&P 500 Emini futures April candlestick consecutive bull bars close above the 20-month exponential moving average (EMA). Monday is the first trading day of the month. The market may gap up at the open, creating a gap on the Monthly, Weekly and Daily charts. Small gaps usually close early. The […]
Crude Oil 6-Month Trading Range
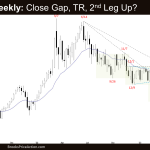
Market Overview: Crude Oil Futures The Crude oil futures continue to trade sideways forming a 6-month trading range. The bulls want a retest and breakout above April 12 high. If the market trades lower, the bulls want a reversal up from a higher low major trend reversal. The bears want a follow-through bear bar in […]
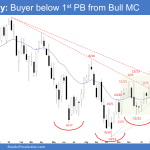
EURUSD Bull Micro Channel
Market Overview: EURUSD Forex EURUSD bull micro channel (7 bars) formed on the weekly chart. That means strong bulls. Odds slightly favor buyers below the first pullback below such a strong bull micro channel. The bears hope that the move up is simply a buy vacuum test of the February 2 trading range high. The bears […]
Bitcoin Consecutive Closes above 20-month EMA
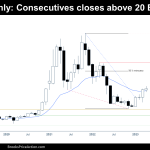
Market Overview: Bitcoin Futures Bitcoin consecutive closes above 20-month EMA. Bitcoin futures increased its value +2.71% during April. Furthermore, during the month, the price achieved a 100% rally from 2022 lows. Bitcoin futures The Monthly chart of Bitcoin futures Analysis Trading The Weekly chart of Bitcoin futures Analysis Trading Market analysis reports archive You can access […]
Nifty 50 Wedge Top
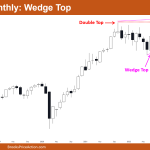
Market Overview: Nifty 50 Futures Nifty 50 wedge top on monthly chart. On the monthly chart, the market produced a powerful bull bar that closed very near to its high. The Nifty 50 was also able to close above the big round number 18000, which may be a sign of strength. Similar to the monthly chart, the market […]
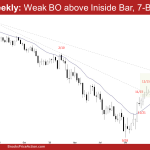
FTSE 100 Small Pullback Bull Trend, Double Top
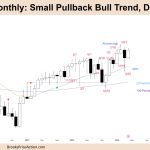
Market Overview: FTSE 100 Futures The FTSE futures market has been in a small pullback bull trend since COVID. We moved higher last month, retracing the deep 50% pullback in March. The bears are happy with the sell-off before and will look to sell above February. The bulls will buy all pullbacks to the moving average […]

