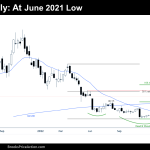
Market Overview: Bitcoin Futures Bitcoin at June 2021 low. This week, the price increased by +2.86% of its value. There were trapped bulls at the June 2021 low who finally got their opportunity to exit their trade. A bear leg should follow. Bitcoin futures The Weekly chart of Bitcoin futures Analysis Trading The Daily chart of […]
FTSE 100 50 Percent Pullback at 100-Week MA
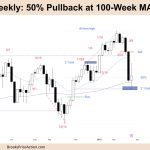
Market Overview: FTSE 100 Futures The FTSE futures market reached a 50 percent pullback last week after two big sell climax weeks. We went sideways with buyers below at the 100-Week MA and sellers up at the 20-week MA. Its not a great buy nor sell signal – but probably better to be short than long […]
DAX 40 Bull Doji Closing above 20-Week MA
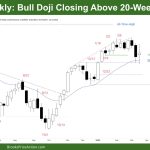
Market Overview: DAX 40 Futures DAX futures moved sideways last week with a bull doji closing above the 20-Week MA. The bears have been unable to get follow-through for many months and have been scalping out at the MA. This leg has the best chance of a small leg sideways to down. But the best […]
Nasdaq 100 First Consecutive Weekly Close above Monthly EMA since 2021
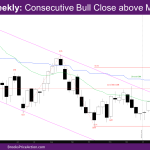
Market Overview: NASDAQ 100 Emini Futures The NASDAQ Emini futures market had a bull follow-through bar to last week and first consecutive weekly close above the monthly exponential moving average (EMA). This is the first time since 2021 that there are two consecutive weekly bull close above monthly EMA. The market went above the February […]
Nifty 50 Big Round Number
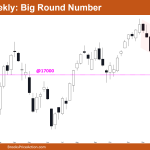
Market Overview: Nifty 50 Futures Nifty 50 big round number acting like a support for the price. Nifty 50 on the weekly is still inside the bear channel and present bear leg is the 3rd bear leg in this bear channel. In this week’s trading, the market formed a tiny bear bar with tails above and […]
Emini May Go Sideways before Bears Get 2nd Leg Down
Trading Update: Friday March 24, 2023 S&P Emini pre-open market analysis Emini daily chart Emini 5-minute chart and what to expect today Yesterday’s Emini setups Al created the SP500 Emini charts. Here are several reasonable stop entry setups from yesterday. I show each buy entry with a green rectangle and each sell entry with a […]
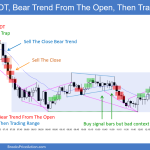
Emini Surprise Outside Down Bar, 2nd Leg Down Likely
Trading Update: Thursday March 23, 2023 S&P Emini pre-open market analysis Emini daily chart Emini 5-minute chart and what to expect today Emini intraday market update Yesterday’s Emini setups Al created the SP500 Emini charts. Here are several reasonable stop entry setups from yesterday. I show each buy entry with a green rectangle and each […]
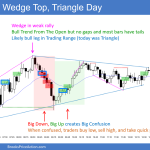
Emini Bulls Want Measured Move Up to 4,150
Trading Update: Wednesday March 22, 2023 Emini pre-open market analysis Emini daily chart Emini 5-minute chart and what to expect today Yesterday’s Emini setups Al created the SP500 Emini charts. Here are several reasonable stop entry setups from yesterday. I show each buy entry with a green rectangle and each sell entry with a red […]
Emini Bulls Strong Entry Bar Wanted after Yesterday’s Buy Signal Bar
Trading Update: Tuesday March 21, 2023 Emini pre-open market analysis Emini daily chart Emini 5-minute chart and what to expect today Emini intraday market update Yesterday’s Emini setups Al created the SP500 Emini charts. Here are several reasonable stop entry setups from yesterday. I show each buy entry with a green rectangle and each sell […]
Emini Bulls Want Upside Breakout of Bear Flag
Trading Update: Monday March 20, 2023 Emini pre-open market analysis Emini daily chart Emini 5-minute chart and what to expect today Friday’s Emini setups Al created the SP500 Emini charts. Here are several reasonable stop entry setups from Friday. I show each buy entry with a green rectangle and each sell entry with a red […]

