Trading Update: Thursday April 6, 2023 S&P Emini pre-open market analysis Emini daily chart Emini 5-minute chart and what to expect today Emini intraday market update Yesterday’s Emini setups Al created the SP500 Emini charts. Here are several reasonable stop entry setups from yesterday. I show each buy entry with a green rectangle and each […]
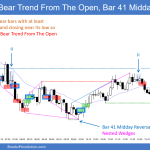
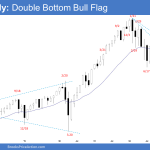
Emini Might Form Inside Day Today
Trading Update: Wednesday April 5, 2023 S&P Emini pre-open market analysis Emini daily chart Emini 5-minute chart and what to expect today Emini intraday market update Yesterday’s Emini setups Al created the SP500 Emini charts. Here are several reasonable stop entry setups from yesterday. I show each buy entry with a green rectangle and each […]
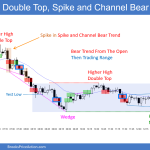
Emini Risk Getting Big for Bulls, Sideways Likely Soon
Trading Update: Tuesday April 4, 2023 S&P Emini pre-open market analysis Emini daily chart Emini 5-minute chart and what to expect today Yesterday’s Emini setups Al created the SP500 Emini charts. Here are several reasonable stop entry setups from yesterday. I show each buy entry with a green rectangle and each sell entry with a […]
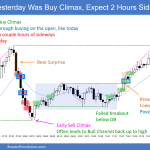
Emini Profit Taking Likely for Day or Two
Trading Update: Monday April 3, 2023 S&P Emini pre-open market analysis Emini daily chart Emini 5-minute chart and what to expect today Emini intraday market update Friday’s Emini setups Al created the SP500 Emini charts. Here are several reasonable stop entry setups from Friday. I show each buy entry with a green rectangle and each […]
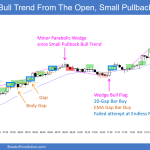
Emini Bull Reversal Bar
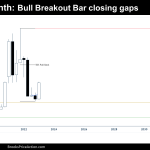
Market Overview: S&P 500 Emini Futures The S&P 500 Emini futures monthly candlestick was an Emini bull reversal bar closing near its high, reversing up from a double bottom bull flag (Dec 22 and Mar 13). Monday is the first trading day of the month. The market may gap up at the open, creating a […]
Crude Oil Failed Breakout
Market Overview: Crude Oil Futures The Crude oil futures looks like a Crude Oil failed breakout after trading far below the triangle and 16-week trading range but reversed higher into the trading range. The bears hope that the market will continue to trade sideways to down in April. The 4 consecutive doji(s) with prominent tails […]
EURUSD Overlapping Candlesticks
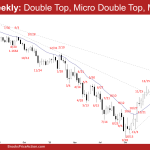
Market Overview: EURUSD Forex The EURUSD Forex monthly chart has 3 overlapping candlesticks. That means that the EURUSD is in a trading range. The bears failed to get follow-through selling in March. The bulls need to create a follow-through bull bar trading above the February high to increase the odds of another leg higher. EURUSD […]
Bitcoin Q1 2023
Market Overview: Bitcoin Futures Bitcoin Q1 2023 Futures increased +73.94% its value during the first Quarter of 2023. Bitcoin is trying to resume the long-term bull trend, but sideways trading between $15000 and $50000 is more likely during the upcoming years. Bitcoin futures The 3-month chart of Bitcoin futures Analysis Trading The Monthly chart of Bitcoin […]
Nifty 50 Doji Bar
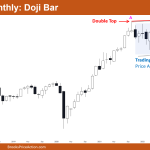
Market Overview: Nifty 50 Futures Nifty 50 doji bar on monthly chart. After three consecutive bear bars, the market created a doji bar this month. The monthly chart is in a bull trend, the market may be trading in a bull channel. The price action over the past 20 bars on the monthly chart shows […]
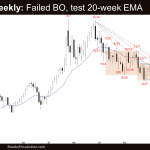
FTSE 100 Failed Breakout or 50% Pullback
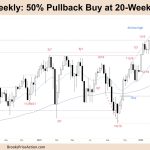
Market Overview: FTSE 100 Futures The FTSE futures market moved lower last month with a FTSE 100 failed breakout, a bear doji bar with a big tail. It is a pullback from the bull trend, and there were buyers below the moving averages. Some traders bought the breakout early and needed to scale in to make […]

