Trading Update: Wednesday April 12, 2023 S&P Emini pre-open market analysis Emini daily chart Emini 5-minute chart and what to expect today Emini intraday market update Yesterday’s Emini setups Al created the SP500 Emini charts. Here are several reasonable stop entry setups from yesterday. I show each buy entry with a green rectangle and each […]
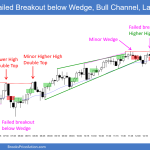
Emini Likely to Disappoint Bulls Soon
Trading Update: Tuesday April 11, 2023 S&P Emini pre-open market analysis Emini daily chart Emini 5-minute chart and what to expect today Yesterday’s Emini setups Al created the SP500 Emini charts. Here are several reasonable stop entry setups from yesterday. I show each buy entry with a green rectangle and each sell entry with a […]
Emini Bears Want 2nd Leg Down
Trading Update: Monday April 10, 2023 S&P Emini pre-open market analysis Emini daily chart Emini 5-minute chart and what to expect today Emini intraday market update Thursday’s Emini setups (previous trading day) Al created the SP500 Emini charts. Here are several reasonable stop entry setups from last Thursday (before Good Friday market holiday). I show […]
Crude Oil Gap Up Bull Doji
Market Overview: Crude Oil Futures Crude oil gap up above the 20-week exponential moving average on the weekly chart and formed a bull doji. The bulls need to create a strong breakout above the trading range high with follow-through buying to increase the odds of a reversal up. The bears want the market to stall […]
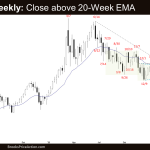
Emini Follow-through Bar above 20-Week EMA
Market Overview: S&P 500 Emini Futures The S&P 500 Emini futures formed a weak follow-through bar after closing above the 20-week exponential moving average. While the move up since March 13 low is in a tight bull channel, it could simply be a bull leg within a trading range until there is a strong breakout […]
EURUSD Bull Leg in Trading Range
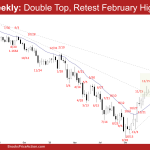
Market Overview: EURUSD Forex EURUSD bull leg currently forming in a trading range. Traders will BLSH (Buy Low, Sell High) within a trading range until there is a strong breakout from either direction with follow-through buying/selling. The bulls want a strong breakout above the February high. The bears want a reversal lower from a double top […]
FTSE 100 Bull Breakout to Sell Climax High
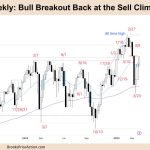
Market Overview: FTSE 100 Futures The FTSE futures market was a big bull breakout and follow-through. We are testing with breakout to sell climax high where trend trading bulls were expecting a move up. They got trapped and now we might let them out. Though the bars are so strong some might hold for a test […]
DAX 40 Bad Follow-through from Bull Breakout
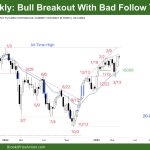
Market Overview: DAX 40 Futures DAX futures had bad follow-through from bull breakout last week — a tiny bear doji. The trend has been strong since October, and we might be in the final flag before the last leg. The bears want to trap the bulls high and reverse back to the moving average. But […]
NASDAQ 100 Pause after Strong Move Up
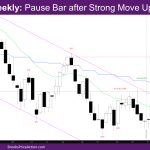
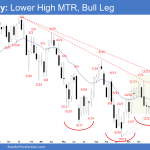
Market Overview: NASDAQ 100 Emini Futures The NASDAQ Emini futures market had a weak doji sell signal pause after strong move up of last week. Since this week is a bad signal bar, it will likely get bought. As last week’s report mentioned, there are targets above. NASDAQ 100 Emini futures The Weekly NASDAQ chart […]
Nifty 50 Breakout Gap
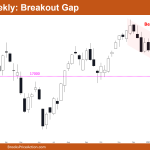
Market Overview: Nifty 50 Futures Nifty 50 breakout gap on the weekly chart. The market gave a strong bull bar this week, closing near to its high and at the high of the bear channel (i.e., a resistance). If the market breaks out of the channel, there will be an immediate resistance above the current […]

