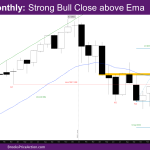
Market Overview: NASDAQ 100 Emini Futures The NASDAQ Emini futures March candlestick is a strong bull close trend bar closing at its high above the February month high. It is also the first bull close above the monthly exponential moving average (EMA) since March 2022. Since February was a weak sell signal bar in a […]
Nifty 50 Doji Bar
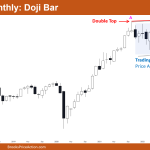
Market Overview: Nifty 50 Futures Nifty 50 doji bar on monthly chart. After three consecutive bear bars, the market created a doji bar this month. The monthly chart is in a bull trend, the market may be trading in a bull channel. The price action over the past 20 bars on the monthly chart shows […]
Emini Final Day of Month
Trading Update: Friday March 31, 2023 S&P Emini pre-open market analysis Emini daily chart Emini 5-minute chart and what to expect today Yesterday’s Emini setups Al created the SP500 Emini charts. Here are several reasonable stop entry setups from yesterday. I show each buy entry with a green rectangle and each sell entry with a […]
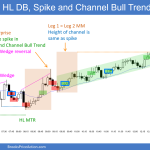
Emini Bulls Chance for Strong Breakout above March 22nd
Trading Update: Thursday March 30, 2023 S&P Emini pre-open market analysis Emini daily chart Emini 5-minute chart and what to expect today Emini intraday market update Yesterday’s Emini setups Al created the SP500 Emini charts. Here are several reasonable stop entry setups from yesterday. I show each buy entry with a green rectangle and each […]
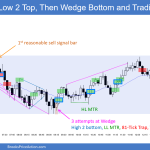
Emini Bulls Trying for 2nd Leg Up
Trading Update: Wednesday March 29, 2023 S&P Emini pre-open market analysis Emini daily chart Emini 5-minute chart and what to expect today Emini intraday market update (I will try and update through-out the day). Yesterday’s Emini setups Al created the SP500 Emini charts. Here are several reasonable stop entry setups from yesterday. I show each […]
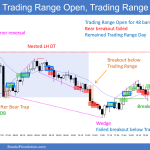
Emini Sideways Around Big Round Number 4,000
Trading Update: Tuesday March 28, 2023 S&P Emini pre-open market analysis Emini daily chart Emini 5-minute chart and what to expect today Yesterday’s Emini setups Al created the SP500 Emini charts. Here are several reasonable stop entry setups from yesterday. I show each buy entry with a green rectangle and each sell entry with a […]
Emini Likely to Disappoint Bull and Bears
Trading Update: Monday March 27, 2023 S&P Emini pre-open market analysis Emini daily chart Emini 5-minute chart and what to expect today Emini intraday market update Yesterday’s Emini setups Al created the SP500 Emini charts. Here are several reasonable stop entry setups from yesterday. I show each buy entry with a green rectangle and each […]
Emini Weak Bull Follow-through
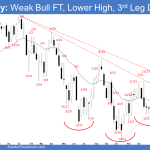
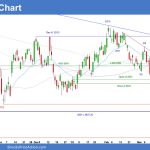
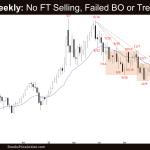
Market Overview: S&P 500 Emini Futures The S&P 500 Emini futures weekly candlestick was a weak bull follow-through bar. The Emini is in a smaller 22-week trading range around 3750 and 4200. The market is currently trading around the middle of this range. Poor follow-through and reversals are hallmarks of a trading range. Traders will […]
Crude Oil Failed Bear Breakout
Market Overview: Crude Oil Futures The Crude oil futures traded slightly lower but had no follow-through selling on the weekly chart, a Crude Oil failed bear breakout. The bears hope that the move is simply a breakout test of the 16-week trading range low (breakout point) and wants at least a small second leg sideways […]
EURUSD Weak Breakout from OO
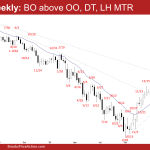
Market Overview: EURUSD Forex The EURUSD Forex weekly candlestick was a EURUSD weak breakout from an OO (outside-outside) pattern. The bulls will need to create follow-through buying to increase the odds of a retest of the February high. The bears want a failed breakout above the OO pattern and a breakout below instead. They want a reversal […]

