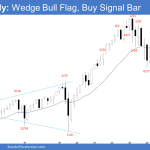
Market Overview: S&P 500 Emini Futures The S&P 500 Emini futures formed an Emini wedge bull flag on the Monthly chart. On the weekly chart, it is in a pullback phase after a strong rally from October low. Odds slightly favor a retest of the October high. The bears on the other hand want a retest of […]
Crude Oil Second Leg Sideways to Up
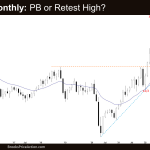
Market Overview: Crude Oil Futures The Crude oil futures is forming a crude oil second leg sideways to up from a higher low major trend reversal (Oct 18) on the weekly chart. It is the second leg up re-testing October 10 high. Bulls want a follow-through bull bar after breaking above the 20-week exponential moving […]
EURUSD Inside Bar Breakout Mode on Monthly Chart
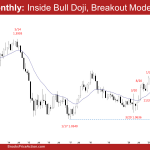
Market Overview: EURUSD Forex The EURUSD Forex market formed an EURUSD inside bar on the Monthly chart and is in breakout mode. On the weekly chart, EURUSD is in a sideways to up pullback. This week traded lower but reversed back higher. Odds slightly favor the EURUSD to still be in the sideways to up pullback phase. […]
Bitcoin Sideways to up over Next Few Months
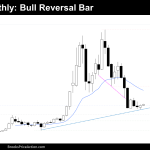
Market Overview: Bitcoin Futures Bitcoin futures traders are likely going to see bitcoin sideways to up, until the end of this year. The long-term view is a Trading Range between $69355 (all-time highs) and $14470 (2017 close). Bitcoin futures The Monthly chart of Bitcoin futures The past month’s candlestick is a bull reversal bar, a […]
FTSE 100 Strong Second Entry Buy
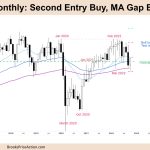
Market Overview: FTSE 100 Futures The FTSE futures market increased last month, setting up a strong second entry buy. The bulls found support at the moving averages (MA.) The bulls see 2 legs sideways to down before trend resumption and a good buy signal. The bears see consecutive bear bars and a second entry short, so […]
DAX 40 Big Bull Bar Closing on its High
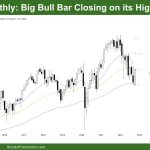
Market Overview: DAX 40 Futures DAX futures moved higher last month with a Dax 40 big bull bar strong reversal closing on its high. The bulls see a pullback on the longer term timeframe and a second reasonable buy setup. The bears see a tight bear channel and are looking to sell again, seeing this […]
Nasdaq 100 Monthly Bull Reversal Bar from below June Low
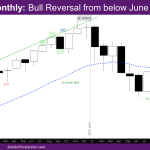
Market Overview: NASDAQ 100 Emini Futures NASDAQ Emini futures October monthly bull reversal bar from below the June low, with a tail at the top and bottom. Since this month is a bull bar, it signifies a failed breakout below last month’s low. At the same time, the market went far below last month’s low that […]
Nifty 50 Futures ioi Pattern
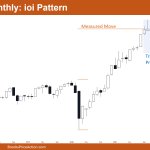
Market Overview: Nifty 50 Futures Nifty 50 futures ioi pattern (inside-outside-inside bar) formed on the monthly chart. The market gave a strong bull close but is currently near the trading range top, so traders would wait for a good follow-through bar (or breakout) before taking any position. The Nifty 50 on the weekly chart gave […]
Emini bounce possible before second leg down
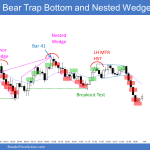
Trading Update: Friday November 4, 2022 Emini pre-open market analysis Emini daily chart The bears got the minimum follow-through yesterday after Wednesday’s large bear breakout bar. The odds are that the market will have a second leg down to the October 21 low; but with an Emini bounce possible going above the November 2 high. […]
Emini May Test down to October 21 Low
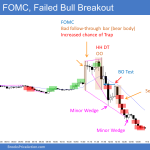
Trading Update: Thursday November 3, 2022 Emini pre-open market analysis Emini daily chart The Emini had a strong reversal following the FOMC report yesterday and the Emini may test down and reach the October 21 low before the market can bottom. The buy-the-close bulls who bought the October 28 bull breakout were disappointed with the […]

