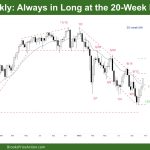
Market Overview: DAX 40 Futures DAX futures moved up again this week, so we are always in long at the 20-Week Moving Average (MA.) It has been an extended bear trend down to the lows of the COVID breakout, and we are testing the breakout on October 28th, 2020. We have retraced 2 years of […]
Emini Triggered H2 Buy Signal but Trading Range
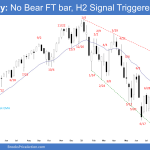
The S&P 500 Emini futures triggered the H2 buy signal on the weekly chart. The bulls need to create a follow-through bull bar to increase the odds of higher prices. Bears want a reversal lower from a double top bear flag with Oct 5 high or around the bear trend line. The Emini is forming a small trading range around the June low between 3500 and 3800. Traders will BLSH (Buy Low, Sell High) until there is a breakout from either direction.
Crude Oil No Follow-through bear bar
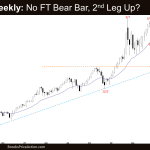
The Crude oil futures traded lower but the bears failed to get a follow-through bear bar and the market closed as a bull doji. The bears hope that this week was simply a pullback and want a second leg sideways to down to re-test the September low. The bulls want a second leg sideways to up re-testing October 7 high. Bulls will likely attempt to trigger the High 2 buy signal by trading above this week’s high.
EURUSD H2 Buy Signal, Need Follow-through
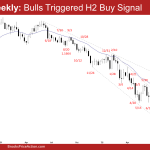
The EURUSD Forex bulls triggered the H2 buy signal on the weekly chart. Next week, the bulls need to create a follow-through bull bar to increase the odds of higher prices. Bears hope that the current pullback is simply forming a double top bear flag with October 4 high. The bear trend line and 20-week exponential moving average are resistances above.
Nifty 50 Futures Triangle
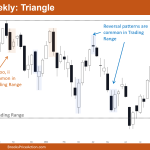
Market Overview: Nifty 50 Futures Nifty 50 futures triangle on the weekly chart is a breakout mode pattern. Traders would prefer to wait for the breakout before taking any position. The overall weekly chart is in a big trading range so traders should not prefer to hold trades for too long with big targets. Nifty […]
Emini testing 50% pullback of October 18 rally
Trading Update: Friday October 21, 2022 Emini pre-open market analysis Emini daily chart The market is testing a 50% pullback of the rally to the October 18 high. The bulls will try their best to get a reversal up here and the bears want the day to close on its low, below the 50% pullback […]
Emini Bulls want breakout above neckline
Trading Update: Thursday October 20, 2022 Emini pre-open market analysis Emini daily chart Yesterday ended, the four-bar bull micro channel and closed as a doji bar. The bulls saw yesterday as a High 1 buy setup. However, the bar is a doji bear near resistance, top of the trading range, and the October 5 high. […]
Emini bulls poor follow-through from October 13 breakout
Trading Update: Wednesday October 19, 2022 Emini pre-open market analysis Emini daily chart The bulls gapped up yesterday, and the market sold off from the opening session and closed around its midpoint. But bulls poor follow-through, and a disappointing bar being a reminder that the market is still in a trading range environment. The bears […]
Bulls trying for upside breakout test of 3,800
Trading Update: Tuesday October 18, 2022 Emini pre-open market analysis Emini daily chart Yesterday, the market rallied and tested last Thursday’s bull close. The bulls see last Friday as a pullback from the rally on October 13. They want the market breakout to the upside and reverse Friday’s bear breakout bar. At the moment, the […]
Emini Bulls Want Rally to Test October 13 Close
Trading Update: Monday October 17, 2022 Emini pre-open market analysis Emini daily chart Friday was a disappointing bar and bad follow-through for the bulls. They want rally to test October 13 close. The bears hope that Thursday was a pullback from the breakout and test of 3,500, and they want today to trigger the short […]

