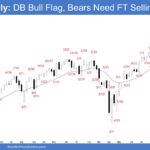
Market Overview: S&P 500 E-mini Futures The market is forming a weekly E-mini pullback. Bears still need strong consecutive bear bars before traders will sell aggressively. Bulls want a retest and breakout above the October 29 high, followed by a resumption of the trend. S&P500 E-mini futures The Weekly S&P 500 E-mini chart The Daily […]
Crude Oil Bulls Want a Second Leg Up
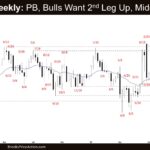
Market Overview: Crude Oil Futures The Crude Oil bulls want a second leg up from a double bottom bull flag (Oct 30 and Nov 6). Bears want at least a small second leg sideways to down to retest the October 20 low, even if it only forms a higher low. Poor follow-through and frequent reversals […]
EURUSD Bear Leg in a Trading Range
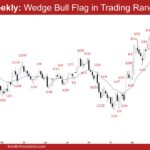
Market Overview: EURUSD Forex The market is forming a EURUSD bear leg in a trading range on the weekly chart. Bulls see a wedge bull flag (Sep 25, Oct 9, Nov 5) forming and want a strong break above the bear microchannel to resume the trend. If the market trades higher, bears want it to […]
Bitcoin Test of 365-day Moving Average and $100,000 Big Round Number

Market Video Report: Bitcoin Duration 6 mins. AI is voicing Josep Capo’s original script. Summary Bitcoin has finally tested the 100,000 level and the 365-day moving average, attempting to break down from a trading range that’s been forming since July. The line in the sand is evident, making this a prime moment to explore various […]
Nasdaq 100 Big Bear Bar Reversing Around September Month Close
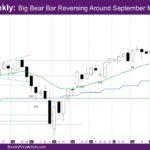
Market Overview: NASDAQ 100 Emini Futures The NASDAQ Emini futures week is a big bear bar reversing around September month close, creating a big tail below. The daily chart had two legs down and is back below the exponential moving average (EMA). This week reversed all of October and found buyers at the close of […]
Nifty 50 Weak Bear Close
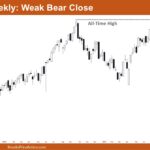
Market Overview: Nifty 50 Futures Nifty 50 Weak Bear Close on the weekly chart. The market is currently trading near the bottom trend line, giving traders a possible opportunity to enter long positions. Bulls attempted to break above the channel but failed to sustain the move. On the daily chart, Nifty 50 is trading within […]
E-mini Getting Strong Follow-through Selling
Trading Update: Friday November 7, 2025 S&P E-mini market analysis E-mini daily chart E-mini 5-minute chart and what to expect today Yesterday’s E-mini setups Richard created the SP500 E-mini chart – Al travelling. Here are reasonable stop entry setups from yesterday. I show each buy entry bar with a green arrow and each sell entry […]
Bitcoin Trading Range Bars Hint Trading Range Action

End of Day Video Report for November 6, 2025 Duration 7.5 mins. AI is voicing Josep Capo’s original script. Summary For Bitcoin today, the majority of bars were trading range bars, prompting traders to buy low and sell high, as expected in such conditions.
E-mini Breakout Below Daily Moving Average
Trading Update: Thursday November 6, 2025 S&P E-mini market analysis E-mini daily chart E-mini 5-minute chart and what to expect today Yesterday’s E-mini setups Richard created the SP500 E-mini chart – Al travelling. Here are reasonable stop entry setups from yesterday. I show each buy entry bar with a green arrow and each sell entry […]
E-mini Finding Support at October 10th Breakout Point High
Trading Update: Wednesday November 5, 2025 E-mini end of day video review Follow Joseph’s YouTube channel for more Al Brooks price action analysis. S&P E-mini market analysis E-mini daily chart E-mini 5-minute chart and what to expect today Yesterday’s E-mini setups Richard created the SP500 E-mini chart – Al travelling. Here are reasonable stop entry […]

