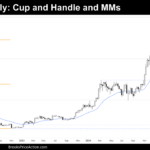
Market Overview: Bitcoin Bitcoin The Weekly chart of Bitcoin The Daily chart of Bitcoin Market analysis reports archive You can access all the weekend reports on the Market Analysis page.
Emini Outside Bear Bar Pullback
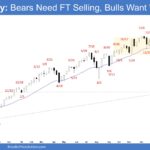
Market Overview: S&P 500 Emini Futures The market formed an Emini outside bear bar pullback on the weekly chart. The bulls want any pullback to be weak and sideways. The bears must create follow-through selling trading below the 20-week EMA and the bull trend line to show they are back in control. S&P500 Emini futures […]
Weekly Crude Oil Double Top Bear Flag
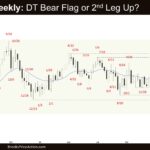
Market Overview: Crude Oil Futures The market formed a weekly Crude Oil double top bear flag, stalling below the April 23 high. The bulls see this week simply as a pullback and want a second leg sideways to up. The bears need to create a strong bear entry bar to increase the odds of retesting […]
EURUSD Retest of the April 21 High
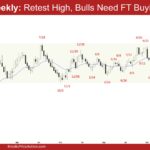
Market Overview: EURUSD Forex The market is forming a EURUSD retest of the April 21 high following the recent pullback. The bulls must create strong follow-through buying over the next few weeks to increase the odds of a successful breakout. The bears see the current move as a retest of the April 21 high and […]
Nifty 50 Inside Bar
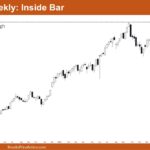
Market Overview: Nifty 50 Futures Nifty 50 Inside Bar on the weekly chart. This week, the market closed with a weak bearish candle, featuring a long lower tail and a small body. Currently, the market is forming an inside bar pattern. A major pattern on the weekly chart is the tight bull channel, and the […]
Nasdaq 100 Bad Follow-Through to Bull Breakout of 5-12
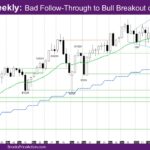
Market Overview: NASDAQ 100 Emini Futures The NASDAQ Emini futures week is a bear bar with prominent tails. It is a bad follow-through to bull breakout of 5-12. The daily chart is sideways to down all week. The monthly chart is a bull trend bar breaking out above the monthly EMA, and the prior April […]
Emini at the Daily Moving Average
Trading Update: Friday May 23, 2025 Emini end of day video review Follow Joseph’s YouTube channel for more Al Brooks price action analysis. S&P Emini market analysis Emini daily chart Emini 5-minute chart and what to expect today Yesterday’s Emini setups Al created the SP500 Emini chart. Here are reasonable stop entry setups from yesterday. […]
Emini Bulls Taking Partial Profits
Trading Update: Thursday May 22, 2025 S&P Emini market analysis Emini daily chart Emini 5-minute chart and what to expect today Yesterday’s Emini setups Al created the SP500 Emini charts. Here are reasonable stop entry setups from yesterday. I show each buy entry bar with a green arrow and each sell entry bar with a […]
Emini Forming Tight Trading Range
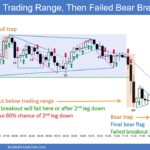
Trading Update: Wednesday May 21, 2025 S&P Emini market analysis Emini daily chart Emini 5-minute chart and what to expect today Yesterday’s Emini setups Al created the SP500 Emini charts. Here are reasonable stop entry setups from yesterday. I show each buy entry bar with a green arrow and each sell entry bar with a […]
Emini Pullback Likely after Test of 6,000
Trading Update: Tuesday May 20, 2025 Emini end of day video review S&P Emini market analysis Emini daily chart Emini 5-minute chart and what to expect today Yesterday’s Emini setups Al created the SP500 Emini charts. Here are reasonable stop entry setups from yesterday. I show each buy entry bar with a green arrow and […]

