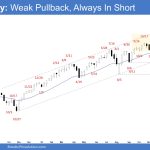
Market Overview: S&P 500 Emini Futures The market formed a weekly weak Emini pullback, forming an outside bear bar closing near its low. The bears want a retest and breakout below the March 13 low. The bulls want the September or August lows to act as support. S&P500 Emini futures The Weekly S&P 500 Emini […]
Crude Oil Pullback to the Middle of Trading Range
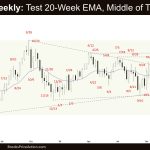
Market Overview: Crude Oil Futures Crude Oil pullback to the middle of trading range on the weekly chart. The bulls need to create more follow-through buying trading far above the 20-week EMA to increase the odds of the bull leg beginning. The bears hope to get a retest of the March 5 low after the […]
Weekly Weak EURUSD Pullback
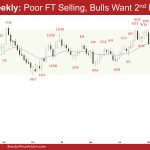
Market Overview: EURUSD Forex The market formed a weekly weak EURUSD pullback, the candlestick closing as a bull doji with a long tail below. The bulls expect to get at least a small sideways to up leg to retest the recent leg extreme high (Mar 18), even if it only forms a lower high. If […]
Bitcoin hint buyers below $80,000
Market Overview: Bitcoin Monday marks the final Bitcoin’s trading day of March and Q1 2025—a prime moment to decode price action. I’ve said it before: expect buying pressure from rebalancing. Q1’s close pushes institutions to adjust portfolios, bringing buyers into play. That alone won’t lift prices—it’s just a piece of the puzzle. Al Brooks cuts […]
Nifty 50 Bull Breakout
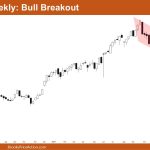
Market Overview: Nifty 50 Futures Nifty 50 Bull Breakout on the weekly chart. This week, the market closed with a doji candlestick, featuring a long upper tail. For a successful bull breakout, the bulls need strong follow-through. On the daily chart, the Nifty 50 nearly reached the measured move of the measuring gap, but the […]
Nasdaq 100 First Close Below Monthly Ema Since October 2023
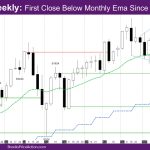
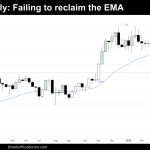
Market Overview: NASDAQ 100 Emini Futures The NASDAQ Emini futures week is a big outside down bear bar closing on its low just below the monthly EMA – exponential moving average. It is the first close below monthly EMA since October 2023. The daily chart started with two bull days to go above the daily […]
Emini Weak High 1 Buy Signal Bar
Trading Update: Friday March 28, 2025 Emini end of day video review S&P Emini market analysis Emini daily chart Emini 5-minute chart and what to expect today Yesterday’s Emini setups Al created the SP500 Emini charts. Here are reasonable stop entry setups from yesterday. I show each buy entry bar with a green arrow and […]
Emini Bad Follow-Through after Yesterday’s Selloff
Trading Update: Thursday March 27, 2025 S&P Emini market analysis Emini daily chart Emini 5-minute chart and what to expect today Yesterday’s Emini setups Al created the SP500 Emini charts. Here are reasonable stop entry setups from yesterday. I show each buy entry bar with a green arrow and each sell entry bar with a […]
Emini Bulls Getting Close above Daily Moving Average
Trading Update: Wednesday March 26, 2025 Emini end of day video review Follow Rose’s YouTube channel for more Al Brooks price action analysis. S&P Emini market analysis Emini daily chart Emini 5-minute chart and what to expect today Yesterday’s Emini setups Al created the SP500 Emini charts. Here are reasonable stop entry setups from yesterday. […]
Emini Likely to Stall at Daily Moving Average
Trading Update: Tuesday March 25, 2025 Emini end of day video review Follow Joseph’s YouTube channel for more Al Brooks price action analysis. S&P Emini market analysis Emini daily chart Emini 5-minute chart and what to expect today Yesterday’s Emini setups Al created the SP500 Emini charts. Here are reasonable stop entry setups from yesterday. […]

