Trading Update: Tuesday March 18, 2025 S&P Emini market analysis Emini daily chart Emini 5-minute chart and what to expect today Yesterday’s Emini setups Al created the SP500 Emini charts. Here are reasonable stop entry setups from yesterday. I show each buy entry bar with a green arrow and each sell entry bar with a […]
Emini Pullback to Moving Average Likely
Trading Update: Monday March 17, 2025 Emini end of day video review Follow Joseph’s YouTube channel for more Al Brooks price action analysis. S&P Emini market analysis Emini daily chart Emini 5-minute chart and what to expect today Friday’s Emini setups Al created the SP500 Emini charts. Here are reasonable stop entry setups from Friday. […]
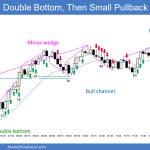
FTSE 100: Breakout Point Pullback, Sideways Up
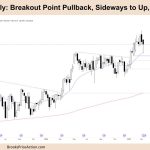
Market Video Overview: FTSE 100 Futures Tim Fairweather’s weekly report on the FTSE 100 futures market. Follow Tim Fairweather’s YouTube channel for more Al Brooks price action analysis. Market analysis reports archive You can access all weekend reports on the Market Analysis page.
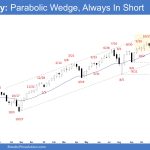
DAX 40: Bull Measured Move Possible Parabolic Wedge

Market Video Overview: DAX 40 Futures Tim Fairweather’s weekly report on the DAX 40 futures market. Follow Tim Fairweather’s YouTube channel for more Al Brooks price action analysis. Market analysis reports archive You can access all weekend reports on the Market Analysis page.
Weekly Emini Parabolic Wedge
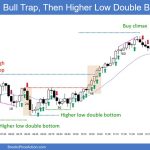
Market Overview: S&P 500 Emini Futures The market formed a weekly Emini parabolic wedge (Feb 28, Mar 7, and Mar 13). The bulls see the market as being in a broad bull channel and want the pullback to form a higher low. If the market trades higher, the bears want the January 13 low, the […]
Weaker Crude Oil Bear Leg
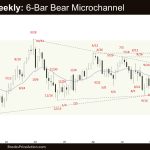
Market Overview: Crude Oil Futures The market formed a weaker Crude Oil bear leg testing the November low area. The bears hope to get a retest of the November 18 low followed by a breakout to test the trading range low. The bulls hope the November low area or the lower third of the trading […]
EURUSD Bulls Want Follow-through Buying
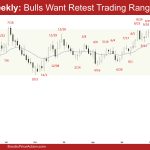
Market Overview: EURUSD Forex The EURUSD bulls want follow-through buying to retest the top of the trading range (Aug/Sep highs). The bears hope the market will stall around the middle of the trading range and form a lower high. The move is strong enough for traders to expect at least a small second leg sideways […]
Bitcoin’s $75K Test: Correction’s Finale or False Dawn
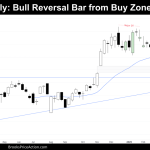
Market Overview: Bitcoin In my previous report, I cast a cautious eye on Bitcoin’s near-term trajectory, diagnosing a bearish tint to the market’s pulse. I highlighted the magnetic pull of lower levels—specifically, the breakout point of 2024’s eight-month trading range, a structural anchor that loomed large beneath the price action. On the IBIT ETF chart, […]
Nasdaq 100 Market Reached Monthly Ema
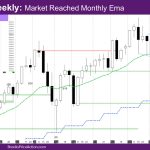
Market Overview: NASDAQ 100 Emini Futures The NASDAQ Emini futures week is a bear bar with a prominent tail below closing below last week’s low. The market reached monthly EMA – exponential moving average for the first time since October 2023. The daily chart started the week with a big bear bar to reach the […]
Nifty 50 Wedge Measured Move
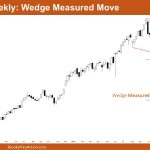
Market Overview: Nifty 50 Futures Nifty 50 Wedge Measured Move on the weekly chart. The market closed bearish this week with a small-bodied candle, providing weak follow-through to the previous strong bullish bar. Bulls were unable to push the price higher towards the top of the channel. Additionally, the market has broken below the wedge […]

