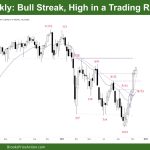
Market Overview: DAX 40 Futures DAX futures have been on a DAX 40 bull streak high in a trading range. Traders will expect the pullback to be minor, but the risk is large for bulls who, up until now, have been buying above bars. The bears see the streak as a bull leg in a […]
Nifty 50 Futures Big Head and Shoulders
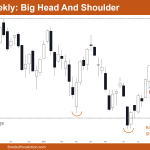
Market Overview: Nifty 50 Futures Nifty 50 on the weekly chart forming a big head and shoulder pattern and currently market going sideways and forming a triangle (right shoulder). Aggressive traders would go long before a triangle breakout as this is also a head and shoulder. The market on the daily chart is forming a […]
Nifty 50 Futures Inside Bar
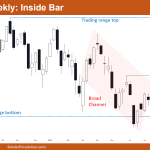
Market Overview: Nifty 50 Futures Nifty 50 futures inside bar on the weekly chart after a bear breakout below a higher high double top neckline. Bears would be exiting now and bulls would be buying, so traders would be expecting one leg up. Nifty 50 on the daily chart is forming a breakout triangle (a […]
Nifty 50 Futures Wedge Bottom
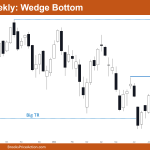
Market Overview: Nifty 50 Futures The Nifty 50 on the weekly chart is forming a Nifty 50 futures wedge bottom and trading range price action, with increasing bad follow-through bars and increasing tails above and below bars. The market is also forming reversal patterns which is a sign that market is in a trading range phase. […]
Nifty 50 Double Top and Increased Trading Range Action
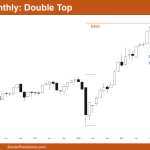
Market Overview: Nifty 50 Futures A Nifty 50 double top formed on monthly chart and showed increasing trading range price action after the breakout of the small bear channel. Market is trading in the current range for the last 10 months now. Nifty 50 on the weekly chart has filled the breakout gap, so now less […]
Nifty 50 Futures Breakout Gap Open
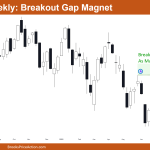
Market Overview: Nifty 50 Futures The Nifty 50 on the weekly chart has a breakout gap open, which acts like a magnet. This week gave a bear bar closing near its low, and now we have 2 consecutive bear bars closing near their lows, which increase the chances of at least one more leg down. Nifty […]
EURUSD Consecutive Bear Bars below 7-Year Trading Range
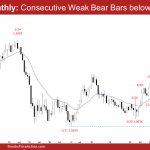
The EURUSD Forex monthly candlestick was a consecutive bear bar below the 7-year trading range low. The long tails below July and August candlesticks indicate that the bears are not as strong as they could have been. Bears want a breakout below the 7-year trading range low followed by a measured move down based on the height of the 7-year trading range which will take them to the year 2000 low. The bulls want a reversal up from a trend channel line overshoot and parabolic wedge (November 24, May 13 and August 23).
Nifty 50 failed major trend reversal
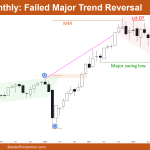
Market Overview: Nifty 50 Futures Nifty 50 failed major trend reversal on the monthly chart. Bears tried to reverse the bull trend by selling lower high double top, but failed to cause a reversal. Rather bulls are now trying to resume the bull trend, by forming consecutive bull bars closing near their high. Nifty 50 […]
Emini possibly sideways trading range soon
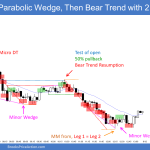
Trading Update: Friday August 12, 2022 Emini pre-open market analysis Emini daily chart Emini possibly sideways trading range soon. The market broke above the midpoint of the year (4,220) and closed near its low yesterday. While the market is in a small pullback bull trend, the odds favor the market forming a trading range soon […]
FTSE 100 consecutive bear bars low in trading range
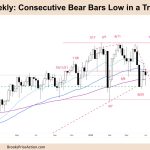
Market Overview: FTSE 100 Futures The FTSE futures market moved lower again last week with FTSE 100 consecutive bear bars low in a trading range. We are back at the October 2021 breakout point and it makes you wonder if this is a failed breakout above the high. With bulls unwilling to buy they might need […]