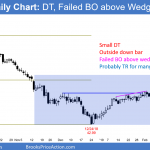
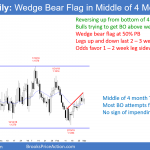
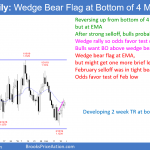
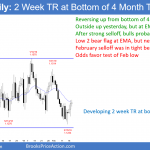
Market Overview The Emini began to pull back this week after a parabolic wedge buy climax on the daily chart. It is at the resistance of the October-November-December triple top and 2800. The streak of 9 consecutive bull bars on the weekly chart ended as well. Traders should expect 2 – 3 weeks of sideways […]
If you are not seeing the latest Weekly Report below, your PC/device browser is likely showing you an earlier page copy. Simply refresh your browser. For PCs you can use the F5 key, or Ctrl-F5, several times if needed.
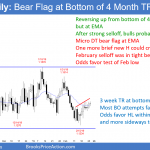
Weekly End of streak of 9 weekly Emini bull bars
Emini streak might reach 10 consecutive weeks up
Intraday market update: Friday March 1, 2019
Emini streak might reach 10 consecutive weeks up I will update again at the end of the day. Pre-Open market analysis Today is the 1st day of March. January and February were strongly bullish. The bulls want the rally to continue throughout March. Today is also the last day of the week. The 2808.00 open […]
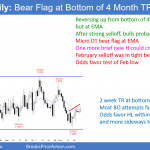
Emini High 1 bull flag but at triple top
Intraday market update: Thursday February 28, 2019
Emini High 1 bull flag but at triple top I will update again at the end of the day. Pre-Open market analysis Today is the final day of the month. On the monthly chart, February will probably be a bull trend bar closing near its high. On the daily chart, every pullback for the past […]
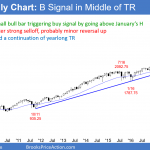
Emini weak High 1 bull flag at 2800 triple top
Intraday market update: Wednesday February 27, 2019
Emini weak High 1 bull flag at 2800 triple top I will update again at the end of the day. Pre-Open market analysis Yesterday was a trading range day. On the daily chart, it is a High 1 bull flag and therefore a buy signal bar. Every pullback this year ended after 1 or 2 […]
Emini breakout above December stock market crash high and 2800
Intraday market update: Tuesday February 26, 2019
Emini breakout above December stock market crash high and 2800 I will update again at the end of the day. Pre-Open market analysis There has been only one instance of more than 9 consecutive bull bars on the weekly chart in the past 20 years. This is now the 10th week in the streak. Consequently, […]
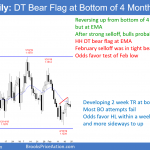
Emini 9th bull week is buy vacuum test of 2800
Intraday market update: Monday February 25, 2019
Emini 9th bull week is buy vacuum test of 2800 I will update again at the end of the day. Pre-Open market analysis Last week was the 9th consecutive week with a bull bar on the weekly chart. There has been only one instance in the past 20 years with a longer streak. Every streak […]
Emini Parabolic wedge buy climax just below 2800 resistance
Weekend market update: February 23, 2019
Market Overview The Emini weekly chart has had 9 consecutive bull trend bars. This is rare and climactic. It is getting drawn to the triple top on the daily chart that is just above 2,800. Because the rally is extreme, bulls will soon take some profits. This will soon create at least a 50 point […]
Emini open of week is magnet after 8 bull weeks
Intraday market update: Friday February 22, 2019
Emini open of week is magnet after 8 bull weeks I will update again at the end of the day. Pre-Open market analysis Today is Friday and therefore today’s close affects the appearance of this week’s candlestick on the weekly chart. The past 8 weeks have had bull bodies. Only once in the past 20 […]
Emini buy climax but 2800 magnet above and no top yet
Intraday market update: Thursday February 21, 2019
Emini buy climax but 2800 magnet above and no top yet I will update again at the end of the day. Pre-Open market analysis The Emini has a buy climax on the daily and weekly charts. But, a climax can continue to rally far longer than what might seem likely. For example, the bulls could […]
Emini 9th consecutive weekly bull bar so buy climax
Intraday market update: Wednesday February 20, 2019
Emini 9th consecutive weekly bull bar so buy climax I will update again at the end of the day. Pre-Open market analysis The Emini yesterday traded above last week’s high and it closed above its open. This week therefore currently is the 9th consecutive bull trend bar on the weekly chart. There has only been […]

