Visión de Mercados: Bitcoin Bitcoin test de un imán en el gráfico Diario. Durante el informe pasado, dije que, seguramente, el precio se dirigiría hacia abajo hasta el apex del Rango del gráfico diario, como así ha terminado ocurriendo durante la semana. En cuanto al gráfico semanal, hay una señal bajista, pero como el precio […]
FTSE 100 Breakout Mode, 2nd Leg Up Likely
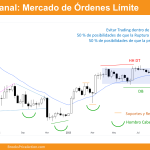
Market Overview: FTSE 100 Futures The FTSE futures market has had shrinking volatility into breakout mode into a triangle near the MAs. While we will probably get a move up and a move down, until the bears break strongly below that bull trend line, the scale in bulls will continue to strongly buy lows and scalp. […]
DAX 40 Sideways at Bear Swing Target, Gap Closed
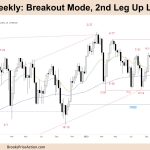
Market Overview: DAX 40 Futures DAX futures moved sideways last week, low in a trading range at the prior swing low. The bears closed the last gaps and have struggled to get a break below this possible wedge bottom channel line. Bulls want to buy, but it is still a low-probability trade until a good […]
Nasdaq 100 Bad Follow-through to Entry Bar of 10/2
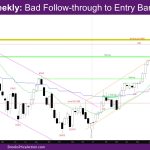
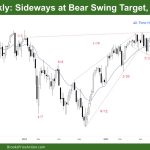
Market Overview: NASDAQ 100 Emini Futures The NASDAQ Emini futures week is a doji bar with a small bull body and a big tail on top. It is a bad follow-through to entry bar of 10/2, closing below last week’s high. On the daily chart, this went up to the high of 9/20 and reversed […]
Nifty 50 Bull Channel
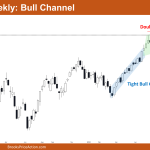
Market Overview: Nifty 50 Futures Nifty 50 Bull Channel on the weekly chart. The market is currently trading close to the bottom of the bull channel after forming a bull bar with a short tail at the top. After the double top reversal attempt, the bears were unable to change the trend. A bear reversal […]
Emini Second Leg Up Likely after Complex Bottom
Trading Update: Friday October 13, 2023 S&P Emini pre-open market analysis Emini daily chart Emini 5-minute chart and what to expect today Emini intraday market update Yesterday’s Emini setups Al created the SP500 Emini charts. Here are reasonable stop entry setups from yesterday. I show each buy entry with a green rectangle and each sell […]
Emini Pullback Likely
Trading Update: Thursday October 12, 2023 S&P Emini pre-open market analysis Emini daily chart Emini 5-minute chart and what to expect today Emini intraday market update Yesterday’s Emini setups Al created the SP500 Emini charts. Here are several reasonable stop entry setups from yesterday. I show each buy entry with a green rectangle and each […]
Emini 4,400 Big Round Number
Trading Update: Wednesday October 11, 2023 S&P Emini pre-open market analysis Emini daily chart Emini 5-minute chart and what to expect today Emini intraday market update Yesterday’s Emini setups Al created the SP500 Emini charts. Here are several reasonable stop entry setups from yesterday. I show each buy entry with a green rectangle and each […]
Emini Testing August 18th Low
Trading Update: Tuesday October 10, 2023 S&P Emini pre-open market analysis Emini daily chart Emini 5-minute chart and what to expect today Yesterday’s Emini setups Al created the SP500 Emini charts. Here are several reasonable stop entry setups from yesterday. I show each buy entry with a green rectangle and each sell entry with a […]
No report today — Brad travelling
Monday October 9, 2023 Brad will be back tomorrow… Friday’s Emini setups Al created the SP500 Emini charts. Here are several reasonable stop entry setups from Friday. I show each buy entry with a green rectangle and each sell entry with a red rectangle. Buyers of both the Brooks Trading Course and Encyclopedia of Chart […]

