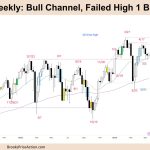
Market Overview: FTSE 100 Futures The FTSE futures market moved sideways in the late stage of a broad FTSE 100 bull channel. It was a failed High 1 buy above a bear micro channel, and the bears should get a little more down. The bulls want to get a second leg after a strong move up […]
DAX 40 All Time High, BO above TTR
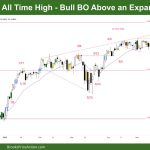
Market Overview: DAX 40 Futures DAX futures moved higher last week to a new Dax 40 All Time High. It was a bull breakout (BO), so traders will watch the follow-through buying next week. The bears are looking to short the trading range highs but haven’t had a good sell signal. Some bears got caught […]
Nasdaq 100 Breakout Attempt above August 2022
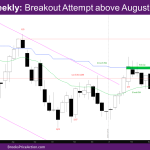
Market Overview: NASDAQ 100 Emini Futures NASDAQ 100 breakout attempt above August 2022 high, and the trading range of past 8 weeks. The question is: Is this a new breakout or a climax bar? Bulls will need a follow-through bar next week to increase the odds this is a breakout. So far the monthly bar […]
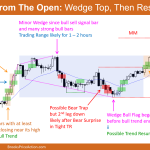
Emini Bull Breakout of Triangle
Trading Update: Friday May 19, 2023 S&P Emini pre-open market analysis Emini daily chart Emini 5-minute chart and what to expect today Emini intraday market update Yesterday’s Emini setups Al created the SP500 Emini charts. Here are several reasonable stop entry setups from yesterday. I show each buy entry with a green rectangle and each […]
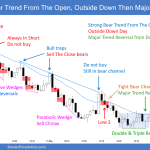
Emini Bulls Want Breakout Follow-through
Trading Update: Thursday May 18, 2023 S&P Emini pre-open market analysis Emini daily chart Emini 5-minute chart and what to expect today Emini intraday market update Yesterday’s Emini setups Al created the SP500 Emini charts. Here are several reasonable stop entry setups from yesterday. I show each buy entry with a green rectangle and each […]
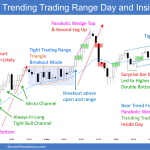
Emini Continues to Disappoint Breakout Traders on Daily Chart
Trading Update: Wednesday May 17, 2023 S&P Emini pre-open market analysis Emini daily chart Emini 5-minute chart and what to expect today Emini intraday market update Yesterday’s Emini setups Richard created the SP500 Emini chart. Here are several reasonable stop entry setups from yesterday. I show each buy entry with a green rectangle and each […]
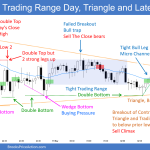
Emini Forming Tight Trading Range
Trading Update: Tuesday May 16, 2023 S&P Emini pre-open market analysis Emini daily chart Emini 5-minute chart and what to expect today Emini intraday market update Yesterday’s Emini setups Richard created the SP500 Emini charts (Al on leave). Here are several reasonable stop entry setups from yesterday. I show each buy entry with a green […]
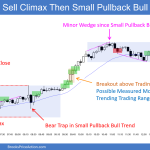
Emini Traders Likely to Face More Sideways Trading
Trading Update: Monday May 15, 2023 S&P Emini pre-open market analysis Emini daily chart Emini 5-minute chart and what to expect today Emini intraday market update Friday’s Emini setups Richard created the SP500 Emini charts (Al on leave). Here are several reasonable stop entry setups from Friday. I show each buy entry with a green […]
Bitcoin test del punto de ruptura del hombro cabeza hombro
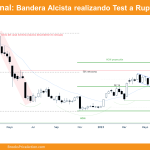
Visión de Mercados: Futuros sobre Bitcoin Bitcoin test del punto de ruptura del hombro cabeza hombro en el gráfico semanal. El precio ha disminuido de valor un -11.02% durante la semana. Esta semana, en vez de activar un setup alcista, el precio se ha girado a la baja formando una pequeña segunda pata lateral bajista y […]
Emini ioi Pattern (inside-outside-inside)
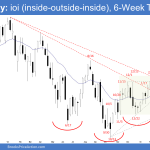
Market Overview: S&P 500 Emini Futures The S&P 500 Emini futures formed an an Emini ioi pattern (inside-outside-inside) on the weekly chart which means the market is in a breakout mode. However, the market is also in a 6-week tight trading range and the Emini is currently trading around the middle of it which is […]

