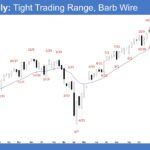
Market Overview: S&P 500 E-mini Futures The market formed a S&P 500 E-mini tight trading range in the last 12 weeks. Bears want a strong breakout below the February 5 low and the 20-week EMA, followed by sustained follow-through selling and a measured move toward 6,500, based on the height of the 12-week trading range. […]
Crude Oil Bulls Need Strong Follow-through
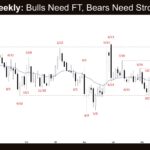
Market Overview: Crude Oil Futures The Crude oil bulls need strong follow-through buying breaking far above the January 29 high to increase the odds of a sustained move. Bears want the September 26 or July 30 highs to act as resistance. Bears need consecutive strong bear bars closing below the 20-week EMA to show they […]
EURUSD Two-Legged Sideways Pullback
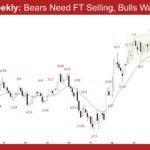
Market Overview: EURUSD Forex The market formed a EURUSD two-legged sideways pullback on the weekly chart. Bulls want the December 24 high or the 20-week EMA to hold as support, followed by a retest of the January 27 high and a sustained breakout above it. Bears need consecutive strong bear bars closing below the 20-week […]
Bitcoin Señal Inside-Inside en Semanal
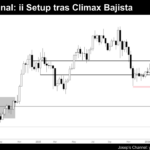
Resumen ¿Se encuentra Bitcoin iniciando una tendencia bajista mayor o simplemente estamos definiendo los límites de un rango lateral? En el análisis de la acción del precio de esta semana, desglosamos la tesis crítica de los «Dos patas bajistas» y el patrón «Inside-Inside» (ii) que se está formando actualmente en el gráfico semanal. Análisis Gráfico […]
Nifty 50 Broad Bull Channel
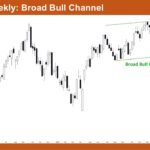
Market Overview: Nifty 50 Futures Nifty 50 Broad Bull Channel and Inside Bar on the weekly chart. The market is trading inside a broad bull channel that has been in place for almost an year. This week, the market formed an inside bar near the upper channel line, which suggests breakout mode. Since this is […]
Gold Bulls Still in Control
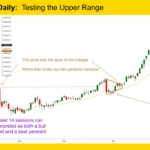
Gold GC-Mini Market Analysis The Gold GC-mini after dipping to a one-month low of nearly $4,400 earlier in February, surged back over $5,000 this week, driven by renewed geopolitical tensions and economic data. Gold prices received a boost on Friday when U.S. Q4 GDP data came in below expectations, reinforcing the appeal of gold as […]
Nasdaq 100 Buy Signal Just Below Ema
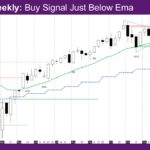
Market Overview: NASDAQ 100 E-mini Futures The NASDAQ E-mini futures week is a buy signal just below EMA – exponential moving average. The buy signal is a good bull bar, and would otherwise be a good buy signal bar, but it is just below the weekly EMA. The daily chart is sideways, likely in a […]
E-mini is Neutral at 6,900 Round Number
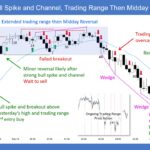
Trading Update: Friday February 20, 2026 E-mini end of day video review S&P E-mini market analysis E-mini daily chart E-mini 5-minute chart and what to expect today Yesterday’s E-mini setups Richard created the SP500 E-mini chart. Here are reasonable stop entry setups from yesterday. Chart shows each buy entry bar with a green arrow and […]
E-Mini Bears Want 2nd Leg Down with February 17th
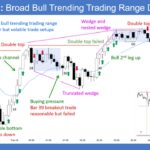
Trading Update: Thursday February 19, 2026 S&P E-mini market analysis E-mini daily chart E-mini 5-minute chart and what to expect today Yesterday’s E-mini setups Richard created the SP500 E-mini chart. Here are reasonable stop entry setups from yesterday. Chart shows each buy entry bar with a green arrow and each sell entry bar with a […]
E-mini Buy Vacuum Test of 6,900 Round Number
Trading Update: Wednesday February 18, 2026 E-mini end of day video review S&P E-mini market analysis E-mini daily chart E-mini 5-minute chart and what to expect today Yesterday’s E-mini setups Richard created the SP500 E-mini chart. Here are reasonable stop entry setups from yesterday. Chart shows each buy entry bar with a green arrow and […]

