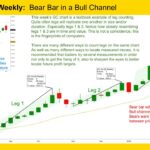
Gold GC-Mini Market Analysis This week the Gold GC-mini printed more daily red bars than green, a rarity in this historical bull run. Price retreated down to the 50% of the parabolic range and subsequent correction, then bounced a little higher, ultimately finding support at the nearby daily moving average. Price is still searching for […]
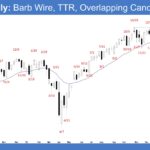
Nasdaq 100 Consecutive Dojis
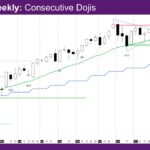
Market Overview: NASDAQ 100 E-mini Futures The NASDAQ E-mini futures week is another doji bear bar – consecutive dojis. The daily chart is sideways between the daily/weekly exponential moving average (EMA) and the November low close. NASDAQ 100 Emini futures The Weekly NASDAQ chart The Daily NASDAQ chart Market analysis reports archive You can access […]
Nifty 50 Head and Shoulders
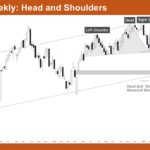
Market Overview: Nifty 50 Futures Nifty 50 Head and Shoulders pattern on the weekly chart. The market has completed a major head and shoulders top with the head reaching above 26,200 and both shoulders forming near 26,000. Price has broken below the neckline with strong bear bars and follow-through, and the measured move projects down […]
E-mini Buyers Likely Scaling In Lower
Trading Update: Friday March 6, 2026 E-mini end of day video reviews S&P E-mini market analysis E-mini daily chart Yesterday’s E-mini setups Richard created the SP500 E-mini chart. Here are reasonable stop entry setups from yesterday. Chart shows each buy entry bar with a green arrow and each sell entry bar with a red arrow. […]
E-mini Bulls Hopeful Buyers below Yesterday’s Low
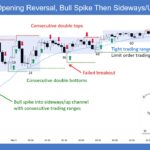
Trading Update: Thursday March 5, 2026 E-mini end of day video review S&P E-mini market analysis E-mini daily chart E-mini 5-minute chart and what to expect today Yesterday’s E-mini setups Richard created the SP500 E-mini chart. Here are reasonable stop entry setups from yesterday. Chart shows each buy entry bar with a green arrow and […]
E-mini Bulls Want 2nd Leg and Test of All-Time High
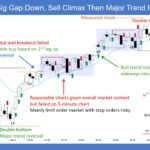
Trading Update: Wednesday March 4, 2026 E-mini end of day video review S&P E-mini market analysis E-mini daily chart E-mini 5-minute chart and what to expect today Yesterday’s E-mini setups Richard created the SP500 E-mini chart. Here are reasonable stop entry setups from yesterday. Chart shows each buy entry bar with a green arrow and […]
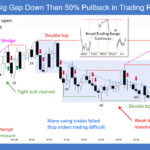
E-mini Bears Getting Downside Breakout of Tight Trading Range
Trading Update: Tuesday March 3, 2026 E-mini end of day video review S&P E-mini market analysis E-mini daily chart E-mini 5-minute chart and what to expect today Yesterday’s E-mini setups Richard created the SP500 E-mini chart. Here are reasonable stop entry setups from yesterday. Chart shows each buy entry bar with a green arrow and […]
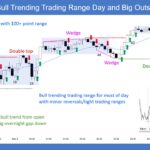
E-mini Bulls Want Upside Breakout
Trading Update: Monday March 2, 2026 E-mini end of day video review S&P E-mini market analysis E-mini daily chart E-mini 5-minute chart and what to expect today Yesterday’s E-mini setups Richard created the SP500 E-mini chart. Here are reasonable stop entry setups from yesterday. Chart shows each buy entry bar with a green arrow and […]
Bitcoin Ruptura Bajista en Mensual y Always In Short probando los $50000
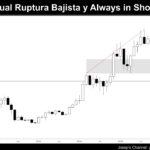
Resumen En este análisis examinamos el ciclo de mercado actual de Bitcoin a través de las escalas mensual, semanal y diaria. Pese a que la ruptura bajista de febrero sitúa al mercado en modo ‘Always In Short’, el contexto general apunta más hacia un gran rango lateral que hacia una nueva tendencia bajista. Entre los […]
Monthly E-mini Tight Trading Range
Market Overview: S&P 500 E-mini Futures The market formed a monthly E-mini tight trading range near the all-time high. Four consecutive dojis signal temporary balance between bulls and bears. Traders will watch for a breakout in either direction and, more importantly, the strength of follow-through. S&P500 E-mini futures The Monthly E-mini chart The Weekly S&P […]

