Trading Update: Tuesday January 6, 2026 S&P E-mini market analysis E-mini daily chart E-mini 5-minute chart and what to expect today Yesterday’s E-mini setups Richard created the SP500 E-mini chart. Here are reasonable stop entry setups from yesterday. Chart shows each buy entry bar with a green arrow and each sell entry bar with a […]
E-mini Breakout Mode near All-Time High
Trading Update: Monday January 5, 2026 E-mini end of day video review Follow Joseph’s YouTube channel for more Al Brooks price action analysis. S&P E-mini market analysis E-mini daily chart E-mini 5-minute chart and what to expect today Friday’s E-mini setups Richard created the SP500 E-mini chart. Here are reasonable stop entry setups from Friday. […]
Monthly Crude Oil Bear Leg
Market Overview: Crude Oil Futures The market formed a monthly Crude Oil bear leg within the trading range. Bears need sustained follow-through selling breaking below the December low to increase the odds of testing the trading range low. Bulls need consecutive strong bull bars breaking above the 7-bar bear microchannel and the 20-month EMA to […]
Monthly EURUSD Double Bottom Bull Flag
Market Overview: EURUSD Forex The market formed a monthly EURUSD double bottom bull flag (August 1 and November 5). Bulls need strong follow-through buying breaking above the September 17 high to increase the odds of the bull trend resuming. Bears want a reversal from a wedge top (April 21, July 1, and September 17) and […]
Bitcoin Cuña en Gráfico Mensual, Giro Bajista y test al Mínimo Ascendente
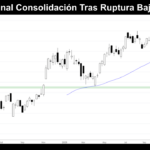
Resumen Bitcoin ha seguido mostrando un crecimiento sólido en aspectos fundamentales durante el último año. Hemos visto avances tecnológicos importantes, un aumento muy significativo en el volumen de transacciones —especialmente en la Lightning Network— y un notable incremento en el número de empresas que lo incluyen como activo de reserva. Además, la adopción ha crecido […]
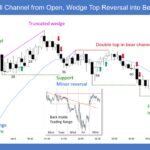
Monthly E-mini Sideways Trading Range
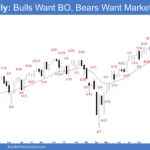
Market Overview: S&P 500 E-mini Futures The market formed a monthly E-mini sideways trading range in the last couple of months. Bulls want a resumption of the bull trend, with targets at the 7,200 round number and a 7,400 measured move based on the height of the recent trading range. Bears want a reversal from […]
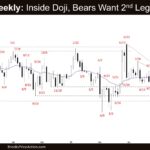
Nasdaq 100 Bear Doji Inside Bar
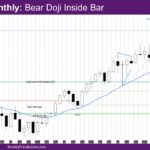
Market Overview: NASDAQ 100 E-mini Futures The NASDAQ E-mini futures December 2025 monthly bar is a bear doji inside bar. The week is a bear bar, continuing the sideways move of the last couple of months. The quarter is a small bull bar with prominent tails. The September monthly report had mentioned that the quarterly […]
Gold’s 2025 Relentless Rise
Gold GC-Mini Market Analysis The Gold GC-mini put in an historic performance in 2025. Prices rose and remained above $4000 for the first time, finishing off with reported gains ranging between 60% – 71%, putting in more than 50 all-time highs! The highest returns since 1979. Gold tripled the S&P 500 with a total return […]
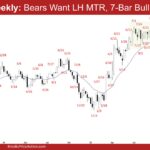
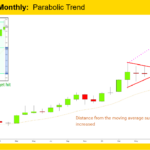
Nifty 50 Wedge Top
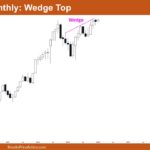
Market Overview: Nifty 50 Futures Nifty 50 Wedge Top on the monthly chart. This month, the market posted a weak bear close with a long tail at the bottom and a small body. Currently, the market is trading near the top of the wedge. On the weekly chart, Nifty 50 has shown strong follow-through this […]
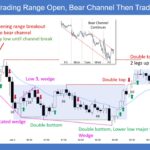
E-mini Breakout Mode on Daily Chart
Trading Update: Friday January 2, 2026 E-mini end of day video review Follow Joseph’s YouTube channel for more Al Brooks price action analysis. S&P E-mini market analysis E-mini daily chart E-mini 5-minute chart and what to expect today Summary of today’s S&P E-mini price action Richard created the SP500 E-mini chart. See the weekly update […]

