
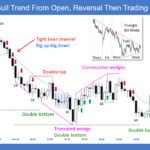
End of Day Video Report for November 20, 2025 Duration 6 mins. AI is voicing Josep Capo’s original script. Summary Bitcoin for November 20th featured a high-quality bear breakout from the opening range, delivering strong downside conviction and continuation—making it a clean, high-probability trend day preferred for most traders over choppy ranges.
E-mini Near Major Support on Daily
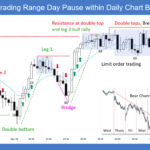
Trading Update: Thursday November 20, 2025 E-mini end of day video review Follow Joseph’s YouTube channel for more Al Brooks price action analysis. S&P E-mini market analysis E-mini daily chart E-mini 5-minute chart and what to expect today Yesterday’s E-mini setups Richard created the SP500 E-mini chart. (Note: EMA interval incorrectly set at 14.) Here […]
E-Mini Bulls Need a Credible Bottom
Trading Update: Wednesday November 19, 2025 S&P E-mini market analysis E-mini daily chart E-mini 5-minute chart and what to expect today Yesterday’s E-mini setups Richard created the SP500 E-mini chart. (Note: EMA interval incorrectly set at 14.) Here are reasonable stop entry setups from yesterday. I show each buy entry bar with a green arrow […]
Bitcoin Measured Move Up of Opening Range around $90,000
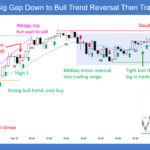
End of Day Video Report for November 18, 2025 Duration 5 mins. AI is voicing Josep Capo’s original script. Summary Bitcoin, on November 18, 2025, exhibited strong bullish price action, advancing in a clear bull channel from an opening near the key $90,000 big round number support on the daily chart. The move achieved the […]
E-mini Support At October 10th Close
Trading Update: Tuesday November 18, 2025 S&P E-mini market analysis E-mini daily chart E-mini 5-minute chart and what to expect today Yesterday’s E-mini setups Richard created the SP500 E-mini chart. Here are reasonable stop entry setups from yesterday. I show each buy entry bar with a green arrow and each sell entry bar with a […]
E-Mini May Have to Reach 7,000 Round Number
Trading Update: Monday November 17, 2025 E-mini end of day video review Follow Joseph’s YouTube channel for more Al Brooks price action analysis. S&P E-mini market analysis E-mini daily chart E-mini 5-minute chart and what to expect today Yesterday’s E-mini setups Richard created the SP500 E-mini chart. Here are reasonable stop entry setups from yesterday. […]
Crude Oil Wedge Bull Flag Pullback
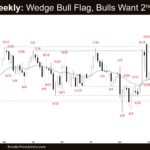
Market Overview: Crude Oil Futures The market formed a Crude oil wedge bull flag pullback. Bulls see the current move as a retest of the October low and want a reversal from a higher-low major trend reversal and a wedge bull flag (Oct 30, Nov 6, Nov 13). If the market trades higher, bears want […]
Weekly EURUSD Wedge Bull Flag
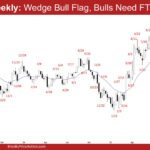
Market Overview: EURUSD Forex The market is forming a weekly EURUSD wedge bull flag within a trading range. The bulls want the 20-week EMA and the August low area to act as support, forming a large double bottom bull flag (Aug 1 and Nov 5). If the market trades higher, bears want it to form […]
E-mini Overlapping Candlesticks
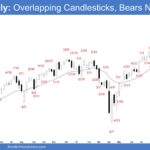
Market Overview: S&P 500 E-mini Futures The weekly chart is forming E-mini overlapping candlesticks indicating two-sided trading. Bears will need consecutive bear bars closing near their lows to show they are in control. Bulls want a retest and breakout above the October 29 high, followed by a resumption of the trend from a double bottom […]
Bitcoin Breakout Bajista de los $100000
Resumen Esta semana, Bitcoin ha mostrado un Price Action fuertemente bajista, que podría estar creando un punto de inflexión. Los traders lo encuentran interesante, ya que ha estado en un rango lateral desde julio, y este movimiento podría iniciar uno direccional más grande en cualquier sentido, ofreciendo jugadas más interesantes. Análisis Gráfico Semanal En el […]

