Monthly S&P500 Emini futures candlestick chart:Testing the January all-time high The August candlestick on the monthly S&P500 Emini futures chart so far is a bull bar. The bears want a double top with the January high, but the odds favor a new all-time high soon. The monthly S&P500 Emini futures candlestick chart is resuming its […]
Emini possible gap up above January all-time high
Emini double top after Cohen and China tariff news
Intraday market update: Friday August 24, 2018
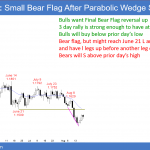
Emini double top after Cohen and Manafort news I will update again at the end of the day. Pre-Open market analysis Yesterday rallied, but reversed down strongly, forming an outside down day. It is therefore a sell signal bar on the daily chart. However, it was a doji bar and the 3rd small day in […]
Emini already priced in Cohen and Manafort
Intraday market update: Thursday August 23, 2018
Emini already priced in Cohen and Manafort I will update again at the end of the day. Pre-Open market analysis The Emini reversed up yesterday after Tuesday’s sell climax. It is a buy signal bar on the daily chart for today. However, the selling on the 60 minute chart was strong enough to make a […]
Emini wedge top bear trend reversal at January all time high
Intraday market update: Wednesday August 22, 2018
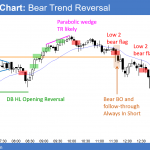
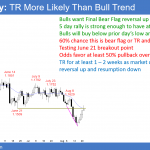
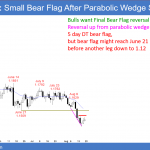
Emini wedge top bear trend reversal at January all time high I will update again at the end of the day. Pre-Open market analysis The cash index reversed down from a small breakout above the January all-time high. The reversal created a sell signal bar on the Emini daily chart. Furthermore, there is a wedge […]
Emini 60 minute wedge rally testing all-time high
Intraday market update: Tuesday August 21, 2018
Emini 60 minute wedge rally testing all-time high I will update again at the end of the day. Pre-Open market analysis Yesterday was a weak bull reversal day, but it spent most of its time in a tight trading range. By going above last week’s high yesterday, the Emini triggered a buy signal on the […]
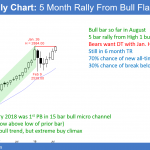
Emini weekly High 1 bull flag below all time high
Intraday market update: Monday August 20, 2018
Emini weekly High 1 bull flag below all time high I will update again at the end of the day. Pre-Open market analysis Last week closed near its high. Therefore, the candlestick on the weekly chart is a High 1 buy signal bar for this week. If this week trades above last week’s high, it […]
Emini High 1 bull flag so imminent all time high
Emini weekend update: August 18, 2018
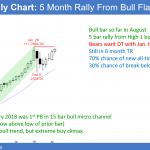
Monthly S&P500 Emini futures candlestick chart:5th month in weak rally The monthly S&P500 Emini futures candlestick chart has a small bar so far in August. The Emini is deciding between a double top and a breakout above the January high. The monthly S&P500 Emini futures candlestick chart has rallied 5 months after February’s strong selloff. […]
Emini unlikely to create outside up candlestick on weekly chart
Intraday market update: Friday August 17, 2018
Emini unlikely to create outside up candlestick on weekly chart I will update again at the end of the day. Pre-Open market analysis The Emini gapped up yesterday and created a 1 day island bottom. While yesterday was a bull trend day, it closed below its high. But, the momentum up good enough to make […]
Emini failed bear breakout below ioi pattern in bull channel
Intraday market update: Thursday August 16, 2018
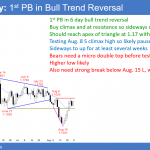
Emini failed bear breakout below ioi pattern in bull channel I will update again at the end of the day. Pre-Open market analysis Yesterday gapped down and sold off early, but reversed up from the March high. That is the top of the 7 month trading range. Yesterday was therefore a reversal day and it […]
Emini ioi breakout mode pattern after island top
Intraday market update: Wednesday August 15, 2018
Emini ioi breakout mode pattern after island top I will update again at the end of the day. Pre-Open market analysis Yesterday was the 3rd sideways day after last week’s reversal down. The bulls want the bull trend to resume up from a higher low. A gap up today would create a 3 day island […]

