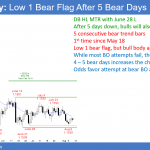
Emini daily buy signal stronger than weekly sell signal I will update again at the end of the day. Pre-Open market analysis Friday was a weak buy signal bar on the daily chart. There were therefore likely sellers above. Yesterday triggered the buy, but then reversed down. It broke below Friday’s low and formed an […]
Emini daily buy signal stronger than weekly sell signal
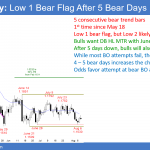
Emini weekly sell signal for double top with January high
Intraday market update: Monday August 13, 2018
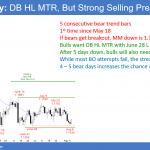
Emini weekly sell signal for double top with January high I will update again at the end of the day. Pre-Open market analysis Last week formed a reversal bar on the weekly chart. While it was not a big bear bar, the context is good for the bears. They now have a credible double top […]
Emini island top forming double top with January all-time high
Emini weekend update: August 11, 2018
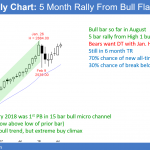
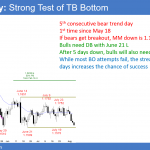
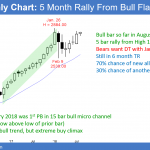
Monthly S&P500 Emini futures candlestick chart:5 month rally, testing all-time high The monthly S&P500 Emini futures candlestick chart has a doji bar so far for August. The bears want a double top with the January high. They need a strong bear bar in August for a sell signal bar. The Emini monthly candlestick chart has […]
Emini outside down day and micro double top
Intraday market update: Friday August 10, 2018
Emini outside down day and micro double top I will update again at the end of the day. Pre-Open market analysis After a 4 day parabolic wedge rally on the 60 minute chart, the Emini has been in a tight range for 3 days. However, yesterday was an outside down day. It also was a […]
Emini pullback from parabolic wedge top on 60 minute chart
Intraday market update: Thursday August 9 2018
Emini pullback from parabolic wedge top on 60 minute chart I will update again at the end of the day. Pre-Open market analysis The Emini had another trading range day yesterday. Its high was below Tuesday high, and therefore yesterday is a High 1 bull flag. But, yesterday had a bear body and is therefore […]
Emini parabolic wedge top at measured move target
Intraday market update: Wednesday August 8, 2018
Emini parabolic wedge top at measured move target I will update again at the end of the day. Pre-Open market analysis The Emini rallied for 4 days in a tight bull channel on the 60 minute chart. This is extreme and unsustainable, and therefore climactic. It pulled back in a tight range yesterday from a […]
Emini buy vacuum test of July high and all-time high
Intraday market update: Tuesday August 7, 2018
Emini buy vacuum test of July high and all-time high I will update again at the end of the day. Pre-Open market analysis Yesterday was the 3rd consecutive strong bull trend day. It broke above last week’s high and the July high. However, the 5 minute chart has been in a tight bull channel for […]
Emini follow-through buying after consecutive outside day
Intraday market update: Monday August 6, 2018
Emini follow-through buying after consecutive outside day I will update again at the end of the day. Thursday was an outside up day after an outside down day on Wednesday. It was therefore a buy signal bar. Friday was the entry bar on the daily chart, and it provided reasonable follow-through buying. This increases the […]
Emini consecutive outside bars in a bull flag
Emini weekend update: August 4, 2018
Monthly S&P500 Emini futures candlestick chart:Strong test of all-time high The monthly S&P500 Emini futures candlestick chart is in a bull trend after a 3 month bull flag. A new all-time high is likely within a couple of months. The bears need a strong bear bar this month if they are going to get a […]
Emini buyers below last week’s sell signal bar
Intraday market update: Friday August 3, 2018
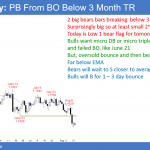
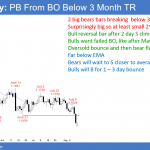
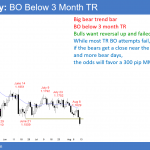
Emini buyers below last week’s sell signal bar I will update again at the end of the day. Pre-Open market analysis I have been saying for the past week that the bears would get a 50 – 100 point pullback over the next couple of weeks, and then the Emini would resume up to a […]

