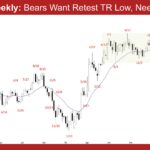
Market Overview: EURUSD Forex Bears want follow-through selling in EURUSD below the 20-week EMA to increase the odds of a test of the trading range low. If the market trades lower, bulls want the lower third of the trading range to provide support. EURUSD Forex market The Weekly EURUSD chart The Daily EURUSD chart Market […]
Gold Bears Roar Back to Control the Week
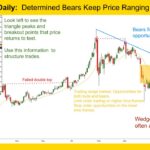
Gold GC-Mini Market Analysis The Gold GC-mini continued in a sideways trading range market. The market printed a sharp weekly reversal bar, pulling back from its all-time highs and sliding down into the 4500 area. Whenever we see a market transition from a massive breakout to a deep pullback it forces the question: is this […]
Nasdaq 100 Bear Doji Week After Six Bull Weeks
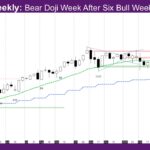
Market Overview: NASDAQ 100 E-mini Futures The NASDAQ E-mini futures week is a bear doji week after six bull weeks. It is the first pause in the bull micro-channel since early April. The daily chart has started to get bear bars or doji bars every couple of bull bars, but buyers are buying the bear […]
High-2 Bear Signal Bar with Long Tail
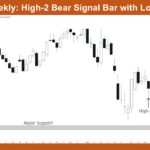
Market Overview: Nifty 50 Futures Nifty 50 High-2 Bear Signal Bar with Long Tail. On the weekly chart, the Nifty 50 has formed a High-2 bear signal bar with a long tail after a sustained downtrend from the highs near 26,200, with the market currently trading above the major support zone around 21,800–22,000. The signal […]
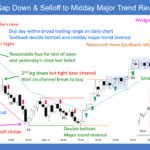
E-mini Profit-Taking at 7,500 Triggers Pullback
Trading Update: Friday May 15, 2026 E-mini end of day video review S&P E-mini market analysis E-mini daily chart E-mini 5-minute chart and what to expect today Yesterday’s E-mini setups Richard created the SP500 E-mini chart. Here are reasonable stop entry setups from yesterday. Chart shows each buy entry bar with a green arrow and […]
E-mini 7,500 Breakout Faces Pullback Risk
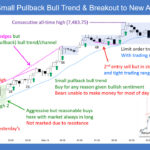
Trading Update: Thursday May 14, 2026 S&P E-mini market analysis E-mini daily chart E-mini 5-minute chart and what to expect today Yesterday’s E-mini setups Richard created the SP500 E-mini chart. Here are reasonable stop entry setups from yesterday. Chart shows each buy entry bar with a green arrow and each sell entry bar with a […]
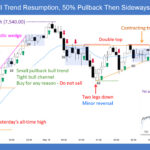
E-mini Sideways Trading Range Likely After Prolonged Bull Trend
Trading Update: Wednesday May 13, 2026 E-mini end of day video review S&P E-mini market analysis E-mini daily chart E-mini 5-minute chart and what to expect today Yesterday’s E-mini setups Richard created the SP500 E-mini chart. Here are reasonable stop entry setups from yesterday. Chart shows each buy entry bar with a green arrow and […]
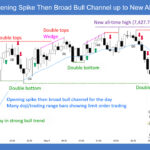
E-mini climactic rally nearing 7,500

Trading Update: Tuesday May 12, 2026 S&P E-mini market analysis E-mini daily chart E-mini 5-minute chart and what to expect today Yesterday’s E-mini setups Richard created the SP500 E-mini chart. Here are reasonable stop entry setups from yesterday. Chart shows each buy entry bar with a green arrow and each sell entry bar with a […]
E-mini Climactic Bull Channel on Daily Chart
Trading Update: Monday May 11, 2026 E-mini end of day video review S&P E-mini market analysis E-mini daily chart E-mini 5-minute chart and what to expect today Friday’s E-mini setups Richard created the SP500 E-mini chart. Here are reasonable stop entry setups from Friday. Chart shows each buy entry bar with a green arrow and […]
Broad Crude Oil Contracting Triangle

Market Overview: Crude Oil Futures The market formed a broad Crude oil contracting triangle with converging trend lines. Bulls want a retest of the March 9 high, followed by a breakout above. Bears need consecutive bear bars closing near their lows and breaking far below the April 17 low to demonstrate control. Crude oil futures […]

