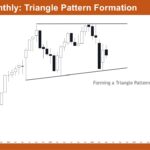
Market Overview: Nifty 50 Futures Nifty 50 Triangle Pattern and a Strong Bearish Move. On the monthly chart, Nifty 50 is forming a multi-month triangle with a flat upper resistance near 26,000 and a rising lower trendline, suggesting that the market is compressing after a strong bull trend. Recent monthly bars show strong bear closes […]
E-mini Sellers at 7,600 Round Number
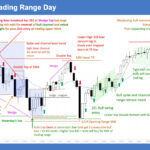
Trading Update: Friday May 29, 2026 E-mini end of day video review S&P E-mini market analysis E-mini daily chart E-mini 5-minute chart and what to expect today Yesterday’s E-mini setups Jed created the SP500 E-mini chart. Here are reasonable stop entry setups from yesterday. Chart shows each buy entry bar with a green arrow and […]
E-mini Profit Taking Likely at 7,600
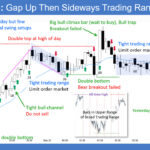
Trading Update: Thursday May 28, 2026 E-mini end of day video review S&P E-mini market analysis E-mini daily chart E-mini 5-minute chart and what to expect today Yesterday’s E-mini setups Jed created the SP500 E-mini chart. Here are reasonable stop entry setups from yesterday. Chart shows each buy entry bar with a green arrow and […]
E-mini Likely to Test May 19 Recent Higher Low

Trading Update: Wednesday May 27, 2026 E-mini end of day video review S&P E-mini market analysis E-mini daily chart E-mini 5-minute chart and what to expect today Yesterday’s E-mini setups Jed created the SP500 E-mini chart. Here are reasonable stop entry setups from yesterday. Chart shows each buy entry bar with a green arrow and […]
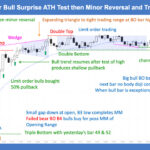
E-mini Testing May All-Time High
Trading Update: Tuesday May 27, 2026 S&P E-mini market analysis E-mini daily chart E-mini 5-minute chart and what to expect today Last Friday’s E-mini setups Richard created the SP500 E-mini chart. Here are reasonable stop entry setups from last Friday (before Monday bank holiday). Chart shows each buy entry bar with a green arrow and […]
E-mini Spike and Bull Channel
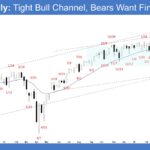
Market Overview: S&P 500 E-mini Futures The market formed an E-mini spike and bull channel in the last 8 weeks. Bulls want any pullback to be weak and sideways, lacking follow-through, with overlapping candlesticks and prominent lower tails. Bears need to generate strong bear bars breaking below the minor bull trend line to indicate strength. […]
Crude Oil Formed a Lower High
Market Overview: Crude Oil Futures Crude oil formed a lower high after testing the top of the triangle. Bears need to create a strong bear entry bar with sustained follow-through selling to increase the odds of a breakout below the triangle. Bulls want any pullback to form a higher low relative to the May 6 […]
EURUSD Bears Need Strong Follow-through Selling

Market Overview: EURUSD Forex The EURUSD bears need strong follow-through selling below the 20-week EMA. Bears want a retest and breakout below the trading range low. Bulls view the current move as a pullback forming a double bottom bull flag (April 30 and May 21). EURUSD Forex market The Weekly EURUSD chart The Daily EURUSD […]
Bitcoin Bajistas ponen a prueba la fuerza del Micro Canal Alcista
Resumen El gráfico semanal de Bitcoin muestra el fin de un microcanal alcista, lo que sitúa al mercado en una fase de corrección (o pullback), a pesar de mantener la premisa de estar «siempre en largo». El gráfico diario revela un techo en cuña y alcistas atrapados cerca de los 81.000 $. Se espera un […]
Nasdaq 100 High 1 Buy Signal After 5-11 Bear Doji
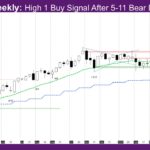
Market Overview: NASDAQ 100 E-mini Futures The NASDAQ E-mini futures week is a High 1 buy signal after 5-11 bear doji. Bulls bought below the low of last week. The daily chart still does not have good follow-through bear bars. The monthly bar is a good follow-through bull trend bar to the biggest bull trend […]

