Trading Update: Thursday June 4, 2026 S&P E-mini market analysis E-mini daily chart E-mini 5-minute chart and what to expect today Yesterday’s E-mini setups Jed created the SP500 E-mini chart. Here are reasonable stop entry setups from yesterday. Chart shows each buy entry bar with a green arrow and each sell entry bar with a […]
E-mini Bulls Taking Profits Betting on Pullback
Trading Update: Wednesday June 3, 2026 E-mini end of day video review S&P E-mini market analysis E-mini daily chart E-mini 5-minute chart and what to expect today Yesterday’s E-mini setups Jed created the SP500 E-mini chart. Here are reasonable stop entry setups from yesterday. Chart shows each buy entry bar with a green arrow and […]
E-mini Unlikely to Close Above Globex Open
Trading Update: Tuesday June 2, 2026 S&P E-mini market analysis E-mini daily chart E-mini 5-minute chart and what to expect today Yesterday’s E-mini setups Jed created the SP500 E-mini chart. Here are reasonable stop entry setups from yesterday. Chart shows each buy entry bar with a green arrow and each sell entry bar with a […]
E-mini Sellers Likely at 7,600 Major Round Number
Trading Update: Monday June 1, 2026 S&P E-mini market analysis E-mini daily chart E-mini 5-minute chart and what to expect today Friday’s E-mini setups Jed created the SP500 E-mini chart. Here are reasonable stop entry setups from Friday. Chart shows each buy entry bar with a green arrow and each sell entry bar with a […]
Bitcoin Vela de Giro Bajista en Gráfico Mensual pero es Zona de Compra
Resumen Los gráficos mensual y semanal de Bitcoin sitúan su valor razonable en 90.000 dólares. Aunque el contexto a largo plazo beneficia a los alcistas, el impulso reciente es bajista tras varias rupturas fallidas. Vender en mínimos actuales ofrece baja probabilidad. Es preferible esperar estructuras alcistas sólidas. Análisis Análisis del Gráfico Mensual y Participación Institucional […]
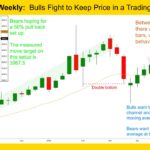
Consecutive Strong Monthly E-mini Bull Bars
Market Overview: S&P 500 E-mini Futures The market formed consecutive strong monthly E-mini bull bars, breaking into new all-time highs. Bulls want a measured move to around 8000 based on the height of the April spike bar. Bears want a failed breakout above the bull trend channel line within a few months, followed by a […]
Monthly Crude Oil ii Pattern
Market Overview: Crude Oil Futures The market formed a monthly Crude oil ii pattern (inside-inside). The market is in breakout mode. Bears want a breakout below the inside bear bar, while bulls want the breakout to fail and reverse up. Crude oil futures The Monthly crude oil chart The Weekly crude oil chart Market analysis […]
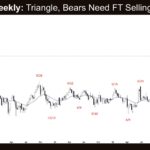
EURUSD Inside Bar in the Middle of the Trading Range
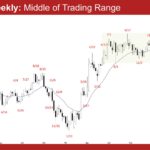
Market Overview: EURUSD Forex The market formed a EURUSD inside bar in the middle of the trading range on the monthly chart. Bulls want a retest of the January 27 high, followed by a strong breakout above. Bears need consecutive strong bear bars breaking below the 20-month EMA to show control. EURUSD Forex market The […]
Gold Three Consecutive Monthly Bear bars = Always in Short
Gold GC-Mini Market Analysis The Gold GC-mini monthly chart posted its third consecutive bear bar, throwing the market into always-in-short. However, the past 2 bear bars are weak doji bars. Doji bars are trading range bars which can be clearly viewed on lower time frame charts. We have not seen 3 consecutive monthly bear bars […]
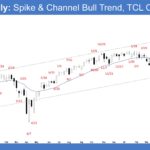
Nasdaq 100 May 2026 Is Strong Follow-Through
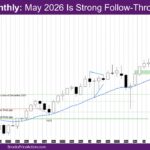
Market Overview: NASDAQ 100 E-mini Futures The NASDAQ E-mini futures May 2026 is strong follow-through to the possibly biggest bull breakout of EMA – exponential moving average. It is also the first time the market has closed above 30000. The week is a good entry bar to the High 1 (H1) buy signal bar of […]

