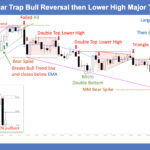
Trading Update: Tuesday June 9, 2026 E-mini end of day video review S&P E-mini market analysis E-mini daily chart E-mini 5-minute chart and what to expect today Yesterday’s E-mini setups Jed created the SP500 E-mini chart. Here are reasonable stop entry setups from yesterday. Chart shows each buy entry bar with a green arrow and […]
E-mini Sell Vacuum Test of May 20 Higher Low
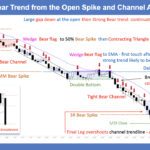
Trading Update: Monday June 8, 2026 S&P E-mini market analysis E-mini daily chart E-mini 5-minute chart and what to expect today Yesterday’s E-mini setups Jed created the SP500 E-mini chart. Here are reasonable stop entry setups from yesterday. Chart shows each buy entry bar with a green arrow and each sell entry bar with a […]
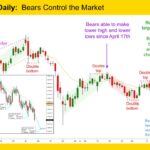
E-mini Bears Need Strong Follow-through Selling
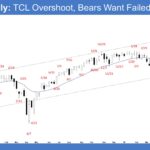
Market Overview: S&P 500 E-mini Futures On the weekly chart, E-mini bears need strong follow-through selling. Bears want a two-legged sideways-to-down pullback lasting a few weeks. Bulls see this week as a pullback and want at least a small sideways-to-up leg to retest the all-time high after the pullback, even if it only forms a […]
Crude Oil Has Formed a Triangle Pattern
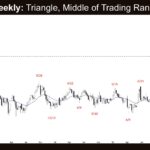
Market Overview: Crude Oil Futures Crude oil has formed a triangle pattern on the weekly chart over the past 13 weeks. Bulls want any pullback to form a higher low relative to the May 6 or April 17 lows. Bears see this week as a pullback and want a second leg sideways to down following […]
EURUSD Formed a Bear Leg Within the Trading Range
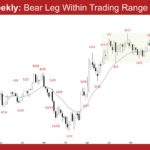
Market Overview: EURUSD Forex EURUSD formed a bear leg within the trading range. Bulls want the lower third of the trading range or the March 13 low area to provide support. Bears want a retest and breakout below the trading range low, followed by a measured move based on the height of the trading range. […]
Bitcoin Sufre una Caída del 20% durante la Semana
Resumen En este informe, se analiza la caída del 20% de Bitcoin, definiendo la barra bajista semanal como un clímax de ventas dentro de un gran rango lateral. Aunque el valor razonable macro sigue sobre los 90.000 $, la acción del precio a corto plazo sugiere un segundo impulso a la baja. Se recomienda calma […]
Gold Bears Create Lower Highs and Lower Lows
Gold GC-Mini Market Analysis The Gold GC-mini was no longer divergent with the S&P 500 and Nasdaq markets this week, with all 3 markets putting in strong bear bars. Gold is steadily moving further away from the psychological 5000 mark. This means that the path of least resistance is down, and the probability of making […]
Nasdaq 100 Profit-Taking After Reaching Measured Move Target
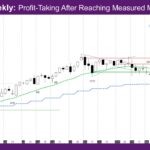
Market Overview: NASDAQ 100 E-mini Futures The NASDAQ E-mini futures week is a big bear bar reversing the past two weeks. This is likely profit-taking after reaching Measured Move target talked about in prior weekly reports. Most of the damage to the week was done on a single day Friday. The daily chart had a […]
Nifty 50 Low-2 Short Opportunity
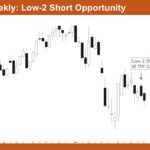
Market Overview: Nifty 50 Futures Nifty 50 Low-2 Short Opportunity. On the weekly chart, Nifty 50 is trading in a sustained bear trend after failing to hold gains above 26,200, and the market is currently presenting a Low-2 short opportunity at the low of a bear bar near the 23,400 area. Each rally attempt has […]
E-mini Testing Daily Moving Average
Trading Update: Friday June 5, 2026 E-mini end of day video review S&P E-mini market analysis E-mini daily chart E-mini 5-minute chart and what to expect today Yesterday’s E-mini setups Jed created the SP500 E-mini chart. Here are reasonable stop entry setups from yesterday. Chart shows each buy entry bar with a green arrow and […]

