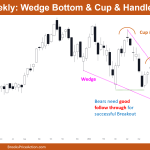
Market Overview: Nifty 50 Futures Nifty 50 wedge bottom with strong bear close this week. Overall structure is climatic and probably a halt expected next week due to wedge bottom. Wedge bottom usually has a double bottom breakout, so bears if want to continue the trend down they would need another bear close next week as […]
DAX failed bull breakout, possible double bottom
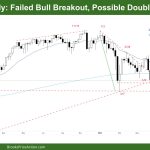
Market Overview: DAX 40 Futures DAX failed bull breakout and a possible double bottom. Traders sold the market for the last 2 weeks so we should get a another leg down but it’s at key support so profit taking will take us sideways. If bulls can get a good reversal that might set the trading […]
FTSE Always in Short at bottom of trading range
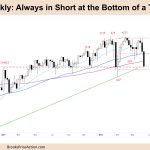
Market Overview: FTSE 100 Futures FTSE always in short at the bottom of a trading range. It could be a sell climax down to the big round number of 7000. The bulls see we are at the bottom of a trading range and will look to scale in short. The bears see we broke down […]
Emini likely to try and rally 200 points soon
Trading Update: Friday June 17, 2022 Emini pre-open market analysis Emini daily chart The Emini is likely to try and rally 200 points soon. Yesterday was a big outside down day and was a second leg from last week’s selloff. Now that the bulls have a second leg down. As strong as yesterday was, the […]
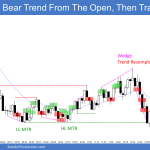
Emini bears likely second leg down
Trading Update: Thursday June 16, 2022 Emini pre-open market analysis Emini daily chart The bulls got a reversal up yesterday; however, they probably need at least a micro double bottom which means the bears likely second leg down will follow. Market formed a bull bar yesterday, ending the streak of 5 consecutive bear bars on […]
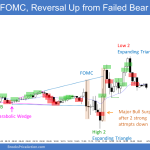
Emini bulls want rally after today’s FOMC report
Trading Update: Wednesday June 15, 2022 Emini pre-open market analysis Emini daily chart Today is a FOMC report day, so there is the potential for a big move up or down at 11:00 PT. Bulls want rally after report. The bears have five consecutive bear bars on the daily chart, so the first reversal up […]
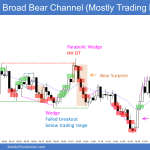
Emini bears trying hard to reach targets below
Trading Update: Tuesday June 14, 2022 Emini pre-open market analysis Emini daily chart Emini bears got a close below the May 20 low and are trying hard to reach targets below, the measured move. The odds are today will have a close above the open and end the streak of consecutive bear closes. The bears […]
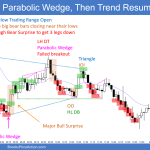
Emini testing 3,800 big round number — a 20% correction
Trading Update: Monday June 13, 2022 Emini pre-open market analysis Emini daily chart Emini testing 3,800 big round number and is currently deciding if it needs to go lower to find buyers. The 3,800 level is a 20% correction from the all-time high, attracting long-term buyers. These buyers are value investors and will be happy […]
Nasdaq big weekly bear reversal
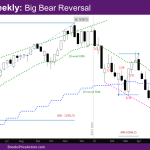
Market Overview: NASDAQ 100 Emini Futures The NASDAQ Emini futures weekly candlestick is a big weekly bear reversal bar closing on its low. This week completely reversed the bull bar from two weeks ago. The week started by continuing the tight trading range from last week. Wednesday was a Low 2 sell signal bar, which […]
EURUSD second leg sideways to down
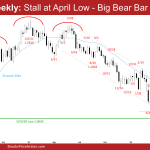
The EURUSD Forex stalled around the April low which was the last breakout point. The bears are now getting the second leg sideways to down that they were expecting. The bulls hope the sell-off this week was simply a sell vacuum test of the low. Odds slightly favor sideways to down next week. Bears want a follow-through bear bar while the bulls want a bull bar even though the EURUSD may trade lower first.

