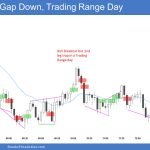
Trading Update: Monday June 6, 2022 Emini pre-open market analysis Emini daily chart (brief update) The bulls have a second entry short following the three consecutive bull bar rally up to May 27. This is a reminder that the overall market is in a trading range. The bears are still hopeful that the three bull […]
EURUSD bull reversal bar and major trend reversal
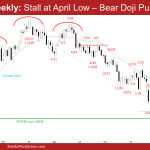
The EURUSD Forex closed as a bull reversal bar on the monthly chart after testing the 2017 low. The bulls want a reversal higher from a lower low major trend reversal bar and a double bottom with the 2017 low.
However, the sell-off since June 2021 has been in a tight bear channel. Odds are, there should be at least a small second leg sideways to down after the pullback because v-bottoms are not common.
NASDAQ first consecutive monthly bear close below EMA since 2008
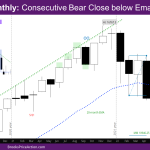
Market Overview: NASDAQ 100 Emini Futures The NASDAQ Emini futures May monthly bar was a doji bear bar with close above midpoint, a big tail above and below, and close below exponential moving average (EMA). It is the first time with a consecutive monthly bear close below EMA since 2008 crash. For an idea of […]
Emini possible failed breakout below trading range?
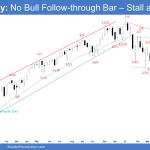
The S&P 500 Emini futures May candlestick closed as a doji bar. The bears failed to get a follow-through bear bar. Bulls see the move down from the January high as a 2 legged pullback and a wedge bull flag (January 24, February 24 and May 20). Bulls will need to close June as a strong bull bar near the high to increase the odds of a failed breakout below the trading range.
Nifty 50 futures increasing trading range price action
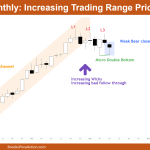
Market Overview: Nifty 50 Futures The Nifty 50 futures after giving a breakdown of bull micro channel on monthly chart now showing increasing trading range price action, and also forming micro double bottom after a Low 3. Nifty 50 on the weekly chart came to support area but weak reversal up without bull strength, which was clearly […]
DAX 40 bull bar at prior breakout point
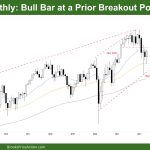
Market Overview: DAX 40 Futures DAX futures was a bull bar at a prior breakout point and at the moving average. It’s a tight trading range on the lower timeframes as traders decide where we are going. The bulls see a weekly major trend reversal and a developing small pullback bull channel. The bears see […]
FTSE 100 bull doji high in trading range
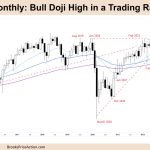
Market Overview: FTSE 100 Futures The FTSE futures market was a bull doji high in a trading range. Limit order traders have been making money on the higher timeframes and until they stop doing so we will go sideways. On the weekly timeframe stop entry traders can make money if they buy low sell high and […]
Emini bulls need follow through today
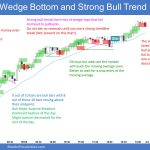
Trading Update: Friday June 3, 2022 Emini pre-open market analysis Emini daily chart Yesterday was a strong bull breakout for the bulls, closing above the high of the past three days. The bulls need follow through today to convince traders this is the start of a strong second leg up. More likely, the bulls will […]
El mercado y el ciclo del mercado
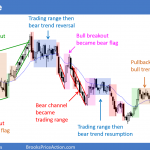
This page is restricted for Trading Course or Trading Room members only. Please log in to view content. Nombre de usuario o correo electrónico Contraseña Recuérdame Contraseña olvidada
¿Cuál debe ser el tamaño de mi posición de trading?

Un principiante se apresura a hacer las cuentas. «Si gano USD 100 al día con un contrato, ¡ganaré 2 millones de dólares al año con 100 contratos!». Se apresura a pensar en utilizar un tamaño de posición de trading grande. Incluso cuando empieza, operando con lo que cree que es una posición pequeña, normalmente está […]


