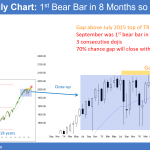
Monthly S&P500 Emini futures candlestick chart: Buy climax The monthly S&P500 Emini futures candlestick chart is forming its 3rd consecutive doji bar. While this is a small bull flag, it is a weak buy setup and there are probably sellers above. The monthly S&P500 Emini futures candlestick chart had 7 consecutive bull trend bars prior […]
Brief October selloff then new all-time high
Day trading the October unemployment jobs report
Intraday market update: October 7, 2016
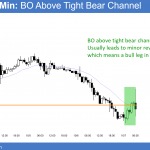
Day trading the October unemployment jobs report Updated 6:55 a.m. The Emini reversed down from above the neck line of the 4 day head and shoulders bottom on the open. Furthermore, it had good follow-through selling. While it is possible that this bear breakout will fail, the odds are against that. The reversal down was […]
Friday unemployment report breakout
Intraday market update: October 6, 2016
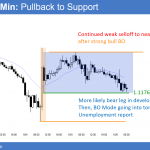
Friday unemployment report breakout Updated 6:51 a.m. Today sold off on the open to below yesterday’s low. Bulls want an early low of the day and then a reversal to above yesterday’s high. That would trigger a 4 day Head and Shoulders bottom. Yet, bears want a measured move down based on yesterday’s range. While […]
Emini October bear flag breakout
Intraday market update: October 5, 2016
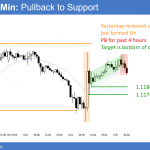
Emini October bear flag breakout Updated 6:44 a.m. While the Emini gapped above the 60 minute moving average, the initial bull bars were small and had prominent tails. This usually happens when the opening rally will fail after about 5 bars. Therefore, the odds are that there will be a pullback soon, and then a […]
Possible bull breakout above Emini bear flag
Intraday market update: October 4, 2016
Possible bull breakout above Emini bear flag Updated 6:49 a.m. Today began with more limit order trading at yesterday’s high, just above the 60 minute moving average. Yesterday was a bull channel and therefore a bear flag. Because the channel lasted more than 20 bars, the probability of a bull breakout is as high as […]
Price action favors stock market October selloff
Intraday market update: October 3, 2016
Price action favors stock market October selloff Updated 6:52 a.m. While the Emini opened just below yesterday’s low, which is support, the 1st 2 bars had bear bodies, which is not much buying at support. Yet, both had big tails below, which means the bears were not especially strong either. As a result of this […]
Ask Al: Buying and selling pressure
Buying and selling pressure areasBPA trading room Q&A: June 9, 2016 Question: I’m interested in knowing how you know certain areas are going to be bought and sold above and below. I’m sure that you’ve mentioned automated traders before.Audio duration: 4min 32sec Trading logic To me, it’s just logic. I’ve made any mistake that you […]
October 5% correction before presidential election
Emini weekend update: October 1, 2016
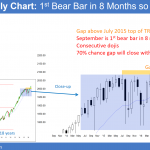
Monthly S&P500 Emini futures candlestick chart:October 5% correction before presidential election The monthly S&P500 Emini futures candlestick chart had a bear bar in September. After 7 consecutive bull trend bars, this therefore ends the buy climax. After 7 consecutive bull trend bars, the monthly S&P500 Emini futures candlestick chart finally had a bear body in […]
S&P500 Emini outside down day
Intraday market update: September 30, 2016
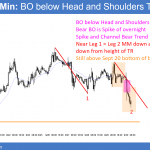
S&P500 Emini outside down day Updated 6:53 a.m. The Emini gapped above the 60 minute moving average after yesterday’s double bottom higher low major trend reversal. Yet, it formed an early tight trading range, and it is above yesterday’s midpoint. This increases the chances of an early selloff. Since yesterday was a big day and […]
October correction but not stock market crash
Intraday market update: September 29, 2016
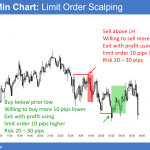
October correction but not stock market crash Updated 6:49 a.m. Today begin with a limit order market within the trading range at the end of yesterday. Furthermore, it opened at the open of the month. Since that is a magnet, the Emini will have a difficult time getting too far. As a result, this will […]


