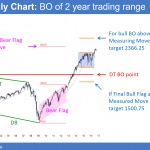
Monthly S&P500 Emini futures candlestick chart:Reversal down into a bull flag The monthly S&P500 Emini futures candlestick chart is pulling back into a bull flag. Less likely, this is the start of a major Final Bull Flag reversal. The monthly S&P500 Emini futures candlestick chart had 7 consecutive bull trend bars prior to this month. […]
September FOMC Fed rate hike
Stock market rally before Fed’s FOMC interest rate announcement
Intraday market update: September 16, 2016
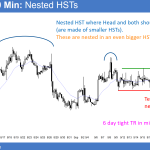
Stock market rally before Fed’s FOMC interest rate announcement Updated 6:52 a.m. The Emini gapped below the 60 minute moving average to around a 50% pullback of yesterday’s rally. This is therefore consistent with what I said yesterday about yesterday’s rally probably being a bull leg in a 5 day bear flag. The bulls want […]
Breakout mode candlestick pattern
Intraday market update: September 15, 2016
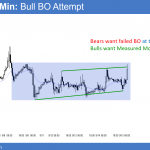
Breakout mode candlestick pattern Updated 6:49 a.m. The Emini opened within the trading range at the end of yesterday. Since yesterday was a Spike and Channel bear trend, the odds favor a rally above the lower highs, and possibly to the 2130 top of the bear channel. That is also at the 60 minute moving […]
Increased volatility before FOMC announcement
Intraday market update: September 14, 2016
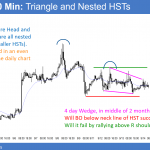
Increased volatility before FOMC announcement Updated 6:55 a.m. The Emini reversed up yesterday from a Higher Low Major Trend Reversal. Yet, it was in a trading range for 5 hours. While the Emini continued Always In Long from yesterday, day traders are waiting for a breakout. Because yesterday was an inside day and today is […]
Emini sell climax and failed bear breakout
Intraday market update: September 13, 2016
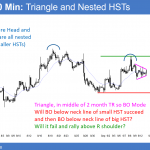
Emini sell climax and failed bear breakout Updated 6:44 a.m. The Emini opened with a big gap down in the middle of yesterday’s range. Because of the confusion, from yesterday, today will probably be a trading range day. Since yesterday was a big day and the Emini is in its middle, today will probably be […]
September stock market crash unlikely
Intraday market update: September 12, 2016
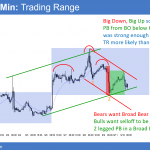
September stock market crash Updated 6:43 a.m. The Emini gapped below yesterday’s low, yet reversed up sharply. The odds are that the 2 hours of sideways to up trading has begun. While there is always a 50% chance of follow-through selling in the 1st 2 hours after a sell climax day, this reversal up was […]
Ask Al: Upsizing advice for consistently profitable trader

Upsizing advice process and default sizesBPA trading room Q&A: August 1, 2016 Question: For a trader that is consistently profitable and now working on increasing size, can you offer any advice on a good process, and defaults for sizing up in your experience? Make $1 million a year? Yeah. I can tell you that it’s […]
September stock market crash is unlikely
Emini weekend update: September 10, 2016
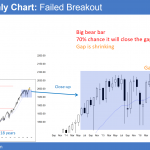
Monthly S&P500 Emini futures candlestick chart:Failed bull breakout The monthly S&P500 Emini futures candlestick chart has a bear body. It will probably have a bear body when the month closes because the rally has been climactic. The monthly S&P500 Emini futures candlestick chart had 7 consecutive bull trend bars as of last month. That is […]
Emini daily double top and weekly bull flag
Intraday market update: September 9, 2016
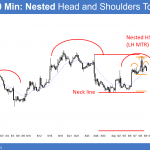
Emini daily double top and weekly bull flag Updated 6:55 a.m. The Emini opened with a big gap down and a pair of bear bars. Because the open is so far below the average price, many bears will wait to sell a rally or trading range that is closer to the moving average. While the […]
Emini weekly bull flag candlestick pattern
Intraday market update: September 8, 2016
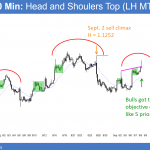
Emini weekly bull flag candlestick pattern Posted 7:01 a.m. Like most days in the 2 month trading range, today had a limit order, trading range open. Both bulls and bears made money with limit orders in the first 5 bars. This reduces the chances of a strong trend day today up or down. Yesterday was […]


