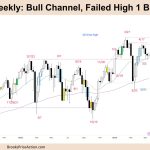
Market Overview: FTSE 100 Futures The FTSE futures market moved sideways in the late stage of a broad FTSE 100 bull channel. It was a failed High 1 buy above a bear micro channel, and the bears should get a little more down. The bulls want to get a second leg after a strong move up […]
Nifty 50 Outside Bar on Weekly
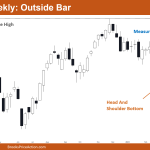
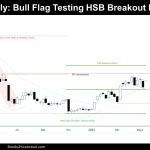
Market Overview: Nifty 50 Futures Nifty 50 outside bar on weekly chart where the market created a bear doji bear this past week. It is currently trading inside a tight bull channel. Measured move of the head and shoulder bottom and the all-time high could be acting like a magnet for the price. The daily […]
Emini Bull Breakout of Triangle
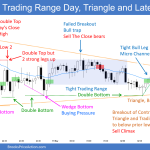
Trading Update: Friday May 19, 2023 S&P Emini pre-open market analysis Emini daily chart Emini 5-minute chart and what to expect today Emini intraday market update Yesterday’s Emini setups Al created the SP500 Emini charts. Here are several reasonable stop entry setups from yesterday. I show each buy entry with a green rectangle and each […]
Emini Bulls Want Breakout Follow-through
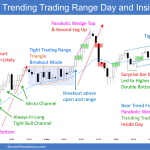
Trading Update: Thursday May 18, 2023 S&P Emini pre-open market analysis Emini daily chart Emini 5-minute chart and what to expect today Emini intraday market update Yesterday’s Emini setups Al created the SP500 Emini charts. Here are several reasonable stop entry setups from yesterday. I show each buy entry with a green rectangle and each […]
Emini Continues to Disappoint Breakout Traders on Daily Chart
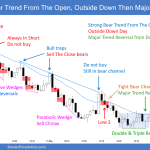
Trading Update: Wednesday May 17, 2023 S&P Emini pre-open market analysis Emini daily chart Emini 5-minute chart and what to expect today Emini intraday market update Yesterday’s Emini setups Richard created the SP500 Emini chart. Here are several reasonable stop entry setups from yesterday. I show each buy entry with a green rectangle and each […]
Emini Forming Tight Trading Range
Trading Update: Tuesday May 16, 2023 S&P Emini pre-open market analysis Emini daily chart Emini 5-minute chart and what to expect today Emini intraday market update Yesterday’s Emini setups Richard created the SP500 Emini charts (Al on leave). Here are several reasonable stop entry setups from yesterday. I show each buy entry with a green […]
Emini Traders Likely to Face More Sideways Trading
Trading Update: Monday May 15, 2023 S&P Emini pre-open market analysis Emini daily chart Emini 5-minute chart and what to expect today Emini intraday market update Friday’s Emini setups Richard created the SP500 Emini charts (Al on leave). Here are several reasonable stop entry setups from Friday. I show each buy entry with a green […]
Bitcoin Test of Head and Shoulders Bottom Breakout Point
Market Overview: Bitcoin Futures Bitcoin test of head and shoulders bottom breakout point on the weekly chart. The price decreased its value by -11.02% during the week. Last week, instead of activating a bullish setup, the price reversed down and created a second leg sideways to down that happens after a bull breakout of a head and […]
EURUSD Big Bear Bar
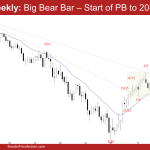
The EURUSD Forex formed a EURUSD big bear bar on the weekly chart. It is likely the start of the pullback phase following the bull’s repeated failed breakout above the February 2 high. The next targets for the bears are the 20-week exponential moving average and the March low. The bulls hope the 20-week exponential moving average […]
Crude Oil Bear Leg within Trading Range
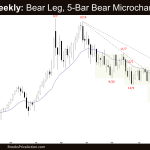
Market Overview: Crude Oil Futures The Crude oil futures formed a crude oil bear leg testing the March low. The bulls hope that the move is simply a sell vacuum and wants a reversal higher from a double bottom and a lower low major trend reversal. The bears want a strong breakout below the March […]

