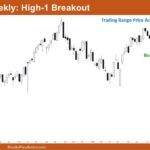
Market Overview: Nifty 50 Futures Nifty 50 High-1 Breakout on the weekly chart. This week, the market gave a weak close with a long tail at the top and a very small body. The market showed a bull breakout of the high-1 but failed to deliver a strong close, and it is still trading inside […]
E-mini Year-end Magnet Trade in Play
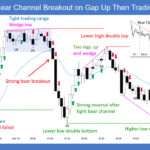
Trading Update: Tuesday December 23, 2025 S&P E-mini market analysis E-mini daily chart E-mini 5-minute chart – What happened today What to expect tomorrow 1. Most likely Bull scenario tomorrow 2. Bull continuation: Break and hold above yesterday’s high (clean follow-through) 3. Pullback/retest: Breakdown from the tight range first to test hourly breakout point ~$6936 […]
E-mini Strong Follow-Through for Bulls
Trading Update: Monday December 22, 2025 E-mini end of day video review Follow Joseph’s YouTube channel for more Al Brooks price action analysis. Summary of today’s S&P E-mini price action Jed created the SP500 E-mini chart – Richard travelling. See the weekly update for a discussion of the price action on the weekly chart and […]
Bitcoin Trading Range on Daily Chart

Market Video Report: Bitcoin Duration 8:29 mins. AI is voicing Josep Capo’s original script. Summary Bitcoin remains stuck in a sideways range, with low volatility and minimal directional conviction. This consolidation phase is likely to persist until trading volume picks up again, most probably during January. The market is now poised for a decisive move: […]
Weekly EURUSD 5-Bar Bull Microchannel
Market Overview: EURUSD Forex The market formed a weekly EURUSD 5-bar bull microchannel from the November 21 low. If the market trades lower, bulls want the 20-week EMA to act as support, followed by at least a small sideways-to-up leg to retest the December 16 high. Bears view the current bounce (Dec 16) as a […]
Crude Oil Large Wedge Bull Flag
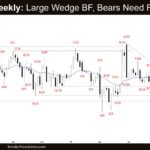
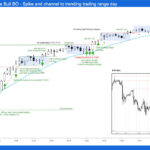
Market Overview: Crude Oil Futures The market formed a Crude oil large wedge bull flag within the trading range. Bulls need consecutive strong bull bars closing well above the 20-week EMA and the bear trend line to show they are gaining control. Bears need consecutive strong bear bars breaking below the October 20 low to […]
Weekly E-mini Second Leg Sideways to Down
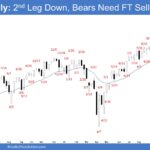
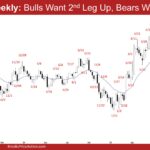
Market Overview: S&P 500 E-mini Futures The market formed a weekly E-mini second leg sideways to down, testing near the 20-week EMA. Bears need strong follow-through selling trading below the 20-week EMA to show they are in control. Bulls want the 20-week EMA to act as support, forming a wedge bull flag, with the first […]
Nifty 50 Bull Channel and Wedge
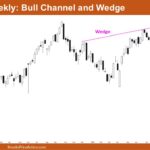
Market Overview: Nifty 50 Futures Nifty 50 Bull Channel and Wedge on the weekly chart. The market closed this week with a weak bullish candle and a small body. It is still trading inside the bull channel and is now near the lower trend line of the channel. Bulls have not shown strong follow-through after […]
Nasdaq 100 Doji Bull Bar Reversing up at Weekly Ema
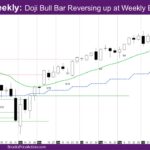
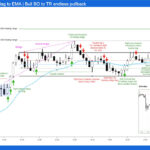
Market Overview: NASDAQ 100 E-mini Futures The NASDAQ E-mini futures week is a doji bull bar reversing up at weekly EMA (exponential moving average), continuing the sideways action into 2025 close. The daily chart continued down to the weekly EMA in two legs and had a reversal up to close into the daily EMA. There […]
E-mini Weak Follow-Through for Bears
Trading Update: Friday December 19, 2025 S&P E-mini market analysis E-mini daily chart E-mini 5-minute chart and what to expect today Yesterday’s E-mini setups Richard created the SP500 E-mini chart. Here are reasonable stop entry setups from yesterday. Chart shows each buy entry bar with a green arrow and each sell entry bar with a […]

