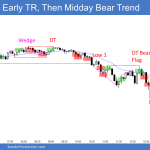
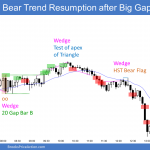
Emini and Forex Trading Update:Thursday November 19, 2020 I will update again at the end of the day. Pre-Open market analysis The Emini formed a big bear trend day yesterday after a 5-day rally. The bears expected at least a small 2nd leg sideways to down after last week’s big bear day. Yesterday might be […]
Emini High 1 bull flag but just below November high
Emini and Forex Trading Update:Wednesday November 18, 2020 I will update again at the end of the day. Pre-Open market analysis The Emini pulled back yesterday, but reversed up from below Tuesday’s low. It is therefore a buy signal bar for today. However, the bull body was small on the daily chart, and that is […]
Emini testing last week’s all-time high on Moderna’s news
Emini and Forex Trading Update:Tuesday November 17, 2020 I will update again at the end of the day. Pre-Open market analysis Most of the days for 3 weeks either closed near their midpoints or their opens. This is uncommon in bull trends that go a long way. However, both Friday and yesterday closed on their […]
Emini has big gap up on Moderna vaccine news
Emini and Forex Trading Update:Monday November 16, 2020 I will update again at the end of the day. Pre-Open market analysis The Emini on Friday reversed up from a micro double bottom. It triggered a weak High 2 bull flag buy signal. However, before the open today, Moderna announced that its vaccine is 94% effective. […]
Is there a perfect trade setup when trading online

When traders start out learning how to trade online, he has a sense that it must be hard to make money. He knows he is competing against the smartest people in the world. However, he hopes that there is a shortcut, some easy, perfect trade setup that might be too small for Goldman Sachs or […]
Emini weak breakout above September all-time high
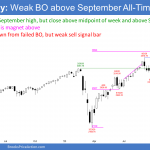
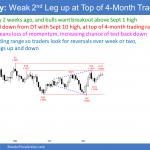
Market Overview: Weekend Market Analysis The SP500 Emini futures market broke to a new all-time high this week on an Emini weak breakout, and reversed back down. The Emini will probably have to go sideways for several more days before traders will decide if the Emini will resume up or reverse down. Bond futures on […]
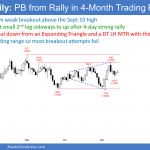
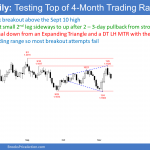
Emini has 60 minute Final Bull Flag just below 3500
Emini and Forex Trading Update:Friday November 13, 2020 I will update again at the end of the day. Pre-Open market analysis The Emini formed a bear bar on the daily chart yesterday, but it closed in the middle of the day’s range, like most of the days over the past 2 weeks. The bears want […]
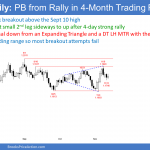
Emini closed yesterday above September all-time highest close
Emini and Forex Trading Update:Thursday November 12, 2020 I will update again at the end of the day. Pre-Open market analysis The Emini yesterday was a small bull day that closed near its high, but just below the September high. Yesterday’s close was just above the September 2 close, and therefore it was a new […]
Emini weak High 1 buy signal after strong reversal down from above September high
Emini and Forex Trading Update:Wednesday November 11, 2020 I will update again at the end of the day. Pre-Open market analysis The Emini yesterday reversed down from a new all-time high and closed below the September all-time high. It did not close at a new all-time high. The selloff fell to below last week’s high. […]
Emini bulls need follow-through buying after huge November gap up
Emini and Forex Trading Update:Tuesday November 10, 2020 I will update again at the end of the day. Pre-Open market analysis The Emini broke far above the all-time high yesterday. This created a gap up on the daily and weekly charts. However, while the day was up about 1.4%, it was a big bear bar […]

