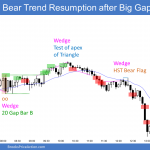
Emini and Forex Trading Update:Tuesday November 10, 2020 I will update again at the end of the day. Pre-Open market analysis The Emini broke far above the all-time high yesterday. This created a gap up on the daily and weekly charts. However, while the day was up about 1.4%, it was a big bear bar […]
Emini breakout to new high on news that Pfizer vaccine is 90% effective
Emini and Forex Trading Update:Monday November 9, 2020 I will update again at the end of the day. Pre-Open market analysis A couple hours before the open today, an announcement on Pfizer vaccine being 90% effective was made. The Emini raced up 4% to a new high. Will the rally reach 3884.00, the measured move […]
The surefire folly of trading with Technical Analysis Indicators

Whenever a trader begins his quest to learn how to make money, he naturally looks for information. Ads and websites are reasonable resources. He will invariably find many that are extremely professional and showcase lots of technical analysis indicators. He then concludes that complicated computer screens with lots of quote screens and charts filled with […]
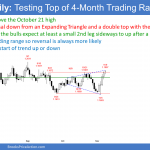
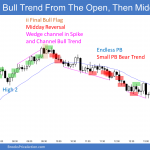
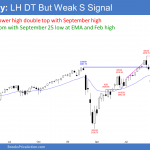
Emini has High 1 bull flag but at top of 4-month triangle
Market Overview: Weekend Market Analysis The SP500 Emini futures contract has rallied strongly to near the top of a 4-month trading range. Friday is a High 1 bull flag buy signal bar on the daily chart. There should be at least a small 2nd leg up, but there might be some profit-taking next week after […]
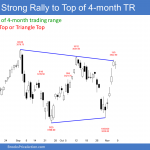
Emini should break above September/October bear trend line
Emini and Forex Trading Update:Friday November 6, 2020 I will update again at the end of the day. Pre-Open market analysis Yesterday was the 5th day in the rally from the double bottom on the daily chart. It stalled at the bear trend line from the September and October highs. If it turns down from […]
Emini profit taking likely after huge November bull trend reversal
Emini and Forex Trading Update:Thursday November 5, 2020 I will update again at the end of the day. Pre-Open market analysis The Emini had another big rally again yesterday. But, like each of the prior 4 days, it closed in the middle of the day’s range. Many bulls are exhausted and have huge profits, and […]
Emini has potential for big move up or down from election and tomorrow’s FOMC
Emini and Forex Trading Update:Wednesday November 4, 2020 I will update again at the end of the day. Pre-Open market analysis The Emini gapped up yesterday, creating a 4-day island bottom. But the day closed in its middle, like the 3 prior days. This makes the reversal up a little less bullish. However, a reversal […]
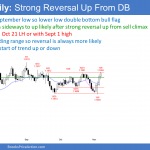
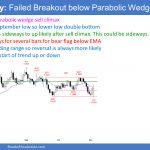
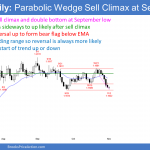
Emini parabolic wedge sell climax and double bottom with September low
Emini and Forex Trading Update:Tuesday November 3, 2020 I will update again at the end of the day. Pre-Open market analysis The Emini has been sideways for 4 days after a parabolic wedge sell climax down to support. Today will probably gap above yesterday’s high. This will create an island bottom with the gap down […]
Emini monthly chart has October ioi Breakout Mode pattern
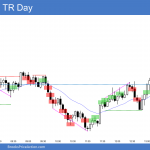
Emini and Forex Trading Update:Monday November 2, 2020 I will update again at the end of the day. Pre-Open market analysis The Emini reversed up on Friday from just above the September low. It is therefore a buy signal bar for a double bottom. But because it had a bear body, it is a weak […]
Emini has ioi sell signal at the end of October on monthly chart
Market Overview: Weekend Market Analysis The SP500 Emini futures market has an ioi sell signal on the monthly chart and a parabolic wedge buy signal on the daily chart. The Emini should bounce next week, but it also should fall below the October low at some point in November. Bond futures are turning down from […]

