
Emini and Forex Trading Update:Monday August 24, 2020 I will update again at the end of the day. Pre-Open market analysis The Emini has been in a tight trading range for 3 weeks. It is tilted slightly up. Traders are wondering if the Emini will break far above the February high. Four of the past […]
Covid-19 CDC report, immunity, HCQ, pseudoscience and patient care

CDC report 215,000 more deaths this year than last Many Covid patients never get diagnosed because they do not seek medical attention. Medical experts believe that the infection rate is 5 to 10 times what has been proven. That means there have been 25 to 50 million Americans already infected. While a lot of testing […]
Emini futures might gap up to new high on weekly chart, but daily chart bull streak is buy climax
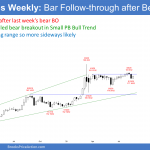
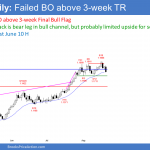
Market Overview: Weekend Market Analysis The S&P500 Emini futures market might gap to a new all-time high on the weekly chart next week. But the streak of 9 consecutive bull bars on the daily chart that ended 2 weeks ago should lead to a pullback to 3200 starting within a couple weeks. Bond futures are […]
Emini weak High 1 bull flag after 9 day bull streak
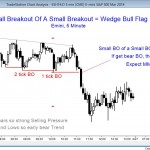
Emini and Forex Trading Update:Friday August 21, 2020 I will update again at the end of the day. Pre-Open market analysis The Emini has been in a Small Pullback Bull Trend since June. Yesterday was another brief pullback. It is a buy signal bar for today. However, the dominant feature on the daily chart is […]
Traders Vibe video podcast with Al Brooks

Professional price action trader Al Brooks Al joined Carl Burgette of FX At One Glance for a “Traders Vibe” video podcast on Thursday August 20, at 1:30pm PT / 4:30pm ET. The podcast Q&A is followed by Al’s analysis of the EURUSD market.
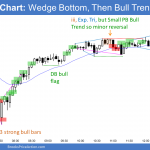
Emini should reverse entire 9 consecutive bull bar buy climax
Emini and Forex Trading Update:Thursday August 20, 2020 I will update again at the end of the day. Pre-Open market analysis Yesterday made a new high, but it was mostly sideways until the FOMC minutes. It then sold off sharply to just above Tuesday’s low. The bears were not strong enough to break below Tuesday’s […]
S&P 500 cash index closed at new high
Emini and Forex Trading Update:Wednesday August 18, 2020 I will update again at the end of the day. Pre-Open market analysis The S&P 500 cash index has poked above the all-time highest close several times over the past week. Because it was hanging just below that resistance instead of reversing down, I have been saying […]
10 best price action trading patterns
10 best price action trading patterns These 10 Best Price Action Trading Patterns are my favorites, and successful traders use these patterns every day to make money. Be flexible because each has many variations. If you keep your mind open to all possibilities, you will begin to see them every day, in every market, and […]
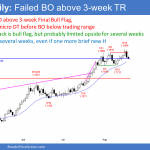
Emini pullback soon to 3000 after 9 day buy climax
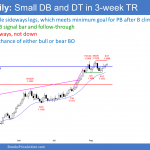
Emini and Forex Trading Update:Monday August 17, 2020 I will update again at the end of the day. Pre-Open market analysis The Emini on Friday traded below Thursday’s low and found buyers. Friday is a High 1 buy signal bar for today. However, it is a doji bar in a 3 bar tight trading range, […]
Emini 10% September correction from double top
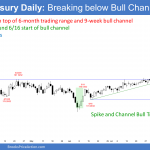
Market Overview: Weekend Market Update The Emini had a streak of 9 consecutive bull bars that ended this week. Traders should expect a 10% correction to begin by the end of the month. Bond futures are correcting down from a Spike and Channel Bull Trend on the daily chart. The selloff should test the June […]

