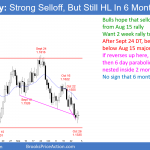
Emini wedge bottom and bear micro channel sell climax I will update again at the end of the day. Financial Market Overview Everything is short-term overdone. I wrote in my weekend blog that the odds are that a rally would probably begin early this week. The high of every day for the past 7 days […]
Emini wedge bottom and bear micro channel sell climax
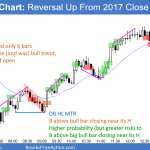
October sell climax finding support at 2017 close
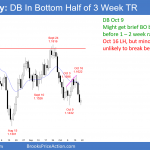
Emini weekend update: October 27, 2018
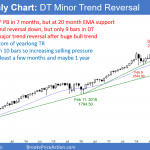
Monthly S&P500 Emini futures candlestick chart:October selloff more likely leg in trading range than start of bear trend The candlestick on the monthly S&P500 Emini futures candlestick chart is a big bear trend bar with 3 days remaining in October. This is the 1st touch of the 20 month EMA since February 2016. The monthly […]
Emini sell climax with consecutive closes below the 2017 close
Intraday market update: Friday October 26, 2018
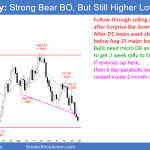
Emini sell climax with consecutive closes below the 2017 close I will update again at the end of the day. Pre-Open market analysis The Emini reversed up in a bull channel yesterday, but collapsed late to end the day again below last year’s close. This is the 2nd consecutive close below that key price and […]
Emini October selloff erased all of 2018 gains
Intraday market update: Thursday October 25, 2018
Emini October selloff erased all of 2018 gains I will update again at the end of the day. Pre-Open market analysis I said at the close of Tuesday and again on yesterday morning that there were 2 problems with Tuesday’s rally. First, the 5 minute chart lacked consecutive big bull bars closing on their highs. […]
Emini weak reversal up from close of 2017
Intraday market update: Wednesday October 24, 2018
Emini weak reversal up from close of 2017 I will update again at the end of the day. Pre-Open market analysis Yesterday formed a good buy signal bar on the daily chart. It reversed up from below the sell climax low from 2 weeks ago. This is a lower low double bottom. After a big […]
Emini minor sell signal for test of last year’s close
Intraday market update: Tuesday October 23, 2018
Emini minor sell signal in middle of October trading range I will update again at the end of the day. Pre-Open market analysis Friday was an inside day on the daily chart and last week was an inside bar on the weekly chart. By trading below Friday’s low, the bears triggered a minor sell signal […]
Emini daily and weekly doji bars after October sell climax
Intraday market update: Monday October 22, 2018
Emini daily and weekly doji bars after October sell climax I will update again at the end of the day. Pre-Open market analysis The Emini formed a doji bar on the daily chart on Friday, and on the weekly chart as well. This is a sign that the bears were exhausted after the big selloff […]
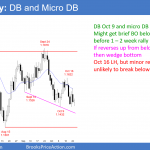
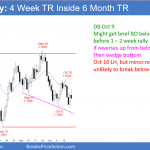
Emini October exhaustive sell climax should test 2017 close of 2689.75
Emini weekend update: October 20, 2018
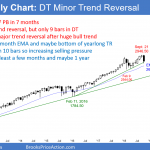
Monthly S&P500 Emini futures candlestick chart:Big bear bar, but trading range more likely than bear trend The monthly S&P500 Emini futures candlestick chart has a big bear bar so far for October. However, it followed a 6 bar bull micro channel. Furthermore, the double top with the January high only has 9 bars. That is […]
Al Brooks BTC Study Group Launched

We are glad to announce that a Facebook Group devoted exclusively to Brooks Price Action (BPA) was launched recently by fellow traders from Al’s complementary website at BrooksPriceAction.com. The forum is a workspace where you can post and discuss the BPA setups, as well as any aspect of the theory and methods presented in the […]
Emini weekly doji inside bar after last week’s sell climax
Intraday market update: Friday October 19, 2018
Emini weekly doji inside bar after last week’s sell climax I will update again at the end of the day. Pre-Open market analysis The Emini triggered a weak sell signal yesterday buy trading below Wednesday’s low. Therefore, the odds are that the Emini will continue the 6 day developing trading range before deciding on the […]

