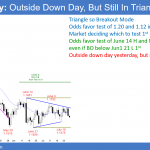
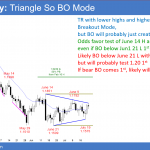
Emini pullback from Wednesday’s bull breakout I will update again at the end of the day. Pre-Open market analysis The Emini formed a small inside bull day yesterday after Wednesday’s late, strong rally. Yesterday is therefore a Breakout Mode bar on the daily chart. The bulls see it as a 1 day bull flag. However, […]
Emini pullback from Wednesday’s bull breakout
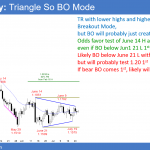
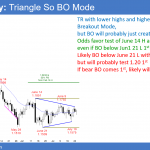
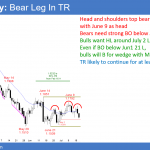
Emini breakout but 50 point pullback likely within 2 weeks
Intraday market update: Thursday July 26, 2018
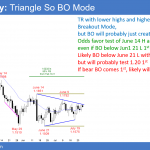
Emini breakout but 50 point pullback likely within 2 weeks I will update again at the end of the day. Pre-Open market analysis The Emini rallied yesterday in a small pullback bull trend. It continued its breakout above the March high. There was an unusually strong late bull breakout. While the bulls want a measured […]
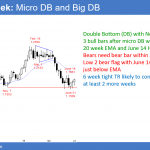
Emini breakout above the March high and 2800 might fail
Intraday market update: Wednesday July 25, 2018
Emini breakout above the March high and 2800 might fail I will update again at the end of the day. Pre-Open market analysis The Emini gapped up yesterday, but then sold off and closed the gap. Because yesterday closed below the open, the bar on the daily chart had a bear body. It is a […]
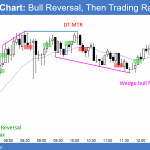
Emini daily buy signal bar and weekly sell signal bar at March high
Intraday market update: Tuesday July 24, 2018
Emini daily buy signal bar and weekly sell signal bar at March high I will update again at the end of the day. Pre-Open market analysis Yesterday, the Emini reversed up from below Friday’s low and the 2800 Big Round Number. It rallied to above Friday’s high and formed an outside up day. This is […]
Weak Emini weekly sell signal for double top above 2800
Intraday market update: Monday July 23, 2018
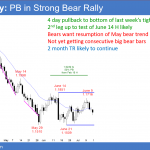
Weak Emini weekly sell signal for double top above 2800 I will update again at the end of the day. Pre-Open market analysis After breaking almost 20 points above the 2800 Big Round Number last week, the Emini pulled back to test 2800 on Friday. The bulls want a resumption of the July rally and […]
Emini breakout above March major lower high needs follow-through
Intraday market update: Wednesday July 18, 2018
Emini breakout above March major lower high needs follow-through I will update again at the end of the day. Pre-Open market analysis Yesterday was a strong bull trend day. Furthermore, the Emini finally broke above the March 13 major lower high, which I said was likely. However, it only closed only 1 tick above. The […]
Emini bull channel but double top bear flag with March high
Intraday market update: Tuesday July 17, 2018
Emini bull channel but double top bear flag with March high I will update again at the end of the day. Pre-Open market analysis The Emini could not sustain a weak bull reversal day yesterday. It was the 5th consecutive small trading range day. Traders want to know if there will be a breakout far […]
Emini in Breakout Mode at 2800 and March major lower high
Intraday market update: July 16, 2018
Emini in Breakout Mode at 2800 and March major lower high I will update again at the end of the day. Pre-Open market analysis The Emini has rallied up to just below the March 13 major lower high of 2811.00. However, until there is a breakout, there is no breakout. The bears are selling up […]
Emini 2800 double top or breakout to new all-time high?
Emini weekend update: July 14, 2018
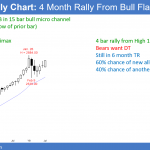
Monthly S&P500 Emini futures candlestick chart:Testing buy climax high The monthly S&P500 Emini futures candlestick chart has a big bull trend bar this month. The bulls need consecutive strong bull bars before traders will believe that the bull trend is resuming. The monthly S&P500 Emini futures candlestick chart has had a 4 month rally after […]
Emini testing key resistance at 2800 Big Round Number
Intraday market update: July 13, 2018
Emini testing key resistance at 2800 Big Round Number I will update again at the end of the day. Pre-Open market analysis The Emini broke above the 2800 Big Round Number for the 1st time since March. However, the March 13 high of 2811.00 is much more important. It is the top of the 6 […]

