Updated 6:43 a.m. The Emini gapped up above the moving average on the open. This is a moving average gap bar. Consequently, if there is a selloff down to yesterday’s low, there will probably be a major trend reversal attempt. Since yesterday was a big outside day, there is an increased chance of today being […]
Emini parabolic wedge at top of wedge bear flag
Emini wedge lower high major trend reversal in strong rally
Intraday market update: February 27, 2018
Emini wedge lower high major trend reversal in strong rally Updated 6:45 a.m. Yesterday had a series of buy climaxes. That increases the odds for exhaustion. An exhausted bull trend typically evolves into a trading range. The early bear bars today are a sign that the bull trend is weakening. They increase the odds of […]
Emini is in breakout mode on the daily and weekly charts
Intraday market update: February 26, 2018
Emini is in breakout mode on the daily and weekly charts Updated 6:55 a.m. The Emini gapped up on the daily and weekly charts and rallied on the open. However, the early bear bar was a sell signal for a possible high of the day. The bull entry bar created confusion. While the Emini is […]
Emini has ii Breakout Mode pattern on weekly chart after FOMC
Emini weekend update: February 24, 2018
Monthly S&P500 Emini futures candlestick chart:February is huge bear doji candle stick February on the monthly S&P500 Emini futures candlestick chart is an huge bear doji in a strong bull trend. The monthly S&P500 Emini futures candlestick chart traded from just below January’s high to far below its low. It then reversed up strongly, but […]
Emini is in Breakout mode on the daily and weekly charts
Intraday market update: February 23, 2018
Emini is in Breakout mode on the daily and weekly charts Updated 6:45 a.m. The Emini broke above yesterday’s bear channel, but immediately stalled at all of the resistance around the open of the week. It is a trading range open in the middle of a 4 day trading range, and in a cluster of […]
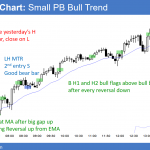
Emini weak bull flag in developing trading range
Intraday market update: February 22, 2018
Emini weak bull flag in developing trading range Updated 6:41 a.m. The Emini opened with a big gap up and a strong bull bar. However, it needs to break strongly above the February 7 lower high, which is around the 60 minute moving average and the top of yesterday’s sell climax. More likely, today will […]
Emini rally stalling at resistance and from Mueller’s investigation
Intraday market update: February 21, 2018
Emini rally stalling at resistance and from Mueller’s investigation Updated 6:42 a.m. The Emini broke above yesterday’s bear channel on the open and is above both the 5 and 60 minute 20 bar EMAs. Yesterday was an expanding triangle, and the bulls have a strong reversal up on the open. They hope this rally will […]
Emini strong bull trend resumption entering sell zone
Intraday market update: February 20, 2018
Emini strong bull trend resumption entering sell zone Updated 6:51 a.m. The Emini reversed up from yesterday’s low and the 60 minute EMA on the open. The bulls want a double bottom and a break above yesterday’s lower high, which is the neck line. A measured move up from there would break above last week’s […]
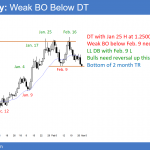
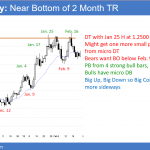
Emini sell climax ended at 10% correction
Emini weekend update: February 17, 2018
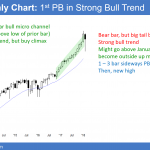
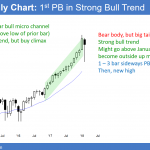
Monthly S&P500 Emini futures candlestick chart: 1st pullback after 16 bar bull micro channel The monthly S&P500 Emini futures candlestick chart had its 1st pullback in 16 bars. The bulls bought below January’s low. The month so far has a big tail below, which indicates strong buying. The monthly S&P500 Emini futures candlestick chart finally […]
Emini testing resistance of lower high and moving average
Intraday market update: February 16, 2018
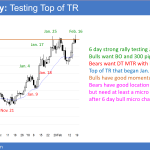
Emini testing resistance of lower high and moving average Updated 6:45 a.m. The Emini reversed up strongly from the moving average on the open. However, it was mostly sideways for the final hour of yesterday and it is within that range. In addition, it is at the target of last week’s lower high. That might […]

