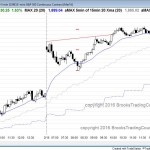
Posted 6:49 a.m. The Emini opened with a big gap up, but had 2 strong bear bars followed by a bull bar. The gap up made the Emini overbought, and the strong bear bars were a sign that traders were willing to sell. This increased the chances of mostly sideways to down trading for a […]
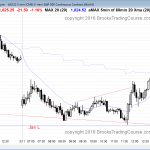
Intraday market update: February 16, 2016
Ask Al: Stop management & scaling in
BPA trading room Q&A: June 17, 2015 (Part 1) Last week, you discussed proper stop management using the ES chart June 11th as your reference. In your book “Trading Price Action Trading Ranges,” you talk about initial stop just beyond the signal bar. Can you use a different stop strategy? Can you elaborate on the […]
Emini weekend update: February 13, 2016:
Day traders expect follow-through bullish price action
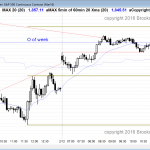
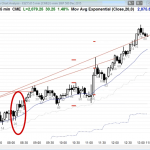
Monthly S&P500 Emini futures candlestick chart: Learn how to trade a buy flag in a buy climax The monthly S&P500 Emini futures candlestick chart remains in a yearlong trading range after a 7 year buy climax. The monthly S&P500 Emini futures candlestick chart is still in a bull flag at the moving average. Because is […]
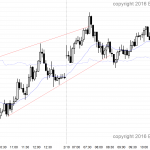
Intraday market update: February 12, 2016
Price action day traders expect a rally
Posted 7:09 a.m. The Emini gapped above yesterday’s high and formed an island bottom on the daily chart. However, the first bars were small and had small bodies with a lot of overlap. Although 4 consecutive bear bars made the market Always In Short, this was a limit order open, and traders were waiting for […]
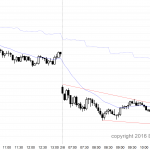
Intraday market update: February 11, 2016
Day trading tip is to be ready for a bull pain trade
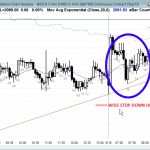
Posted 7:13 a.m. The Emini opened with a big gap down and then rallied. The rally had weak follow-through and it looks more like a bull leg in a trading range. Unless the bulls are able to create big consecutive bull trend bars, the odds are that there will be a bear leg that starts […]
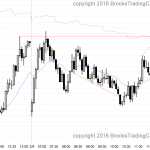
Intraday market update: February 10, 2016
Day trading tip is to be ready for a bear rally
Posted 7:09 a.m. Today began with a limit order open just below yesterday’s high and last week’s low. The 2 day rally has been a bear flag. Coming into the day, the bulls wanted a bull breakout back above last week’s low and into the upper trading range. The bears wanted a reversal down from […]
Intraday market update: February 9, 2016
Learn how to trade when the price action is confusing
Posted 7:00 a.m. Today opened with a big gap down and the bulls bought it aggressively, creating a trend from the open bull trend and the 4th big reversal since yesterday’s gap down. Even though the swings up and down have been very big, this is trading range price action. There will probably be a […]
Intraday market update: February 8, 2016
Learn how to trade a gap down in a trading range
Posted 7:00 a.m. The Emini opened with a big gap down, but then then reversed up and down with big bars. This increases the chances that the Emini will enter a trading range for a couple of hours until it gets closer to the moving average. At that point, bulls will see a bottom, like […]
Ask Al: Advice on 2nd leg traps
BPA trading room Q&A: November 18, 2015 Do you have any advice on how to look for second leg traps? For example, bar 20 to 22 could be a second leg trap. Video duration: 3min 4sec You can also view this video on Al’s YouTube Channel if needed. Video transcript — Any advice on 2nd […]
Emini weekend update: February 6, 2016:
Trade the markets for a living when more trading range price action is likely
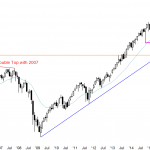
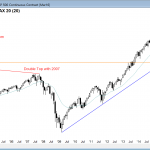
Monthly S&P500 Emini futures candlestick chart: Double top after buy climax The monthly S&P500 Emini futures candlestick chart is in breakout mode with both a double top and a double bottom after a buy climax. The monthly S&P500 Emini futures candlestick chart has a lot of price action left to the month and it is […]

