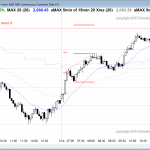
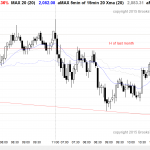
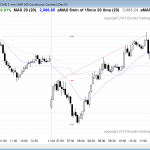
Posted 7:05 a.m. The Emini opened with a strong bull breakout and an early test above last week’s low. The bears want a sell vacuum test of last week’s low and the 60 minute moving average, and then an endless pullback and a bear trend day. It is more likely that the buy climax on […]
Intraday market update: December 4, 2015
Intraday market update: December 3, 2015
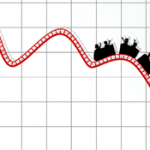
Learn how to trade a bear breakout on the 60 minute chart
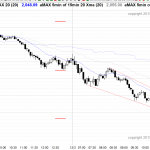
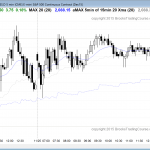
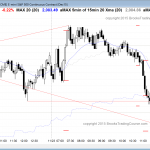
Posted 7:17 a.m. The Emini began with big bars and big reversals. This is a dangerous environment for most traders because the big bars increase the risk and the big reversals lower the probability of a swing trade. The 6th bar triggered an expanding triangle buy from a reversal up from yesterday’s low, and the […]
Intraday market update: December 2, 2015
Learn how to trade a divergence
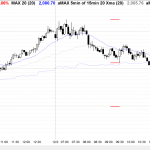
Posted 7:20 a.m. The Emini began with a rally, but it was mostly trading range price action with multiple reversals. This made it more likely a bull leg in what would become a trading range than the start of a strong bull trend. The bulls want at least 1 – 2 hours of follow-through buying […]
Intraday market update: December 1, 2015
Learn how to trade quiet price action
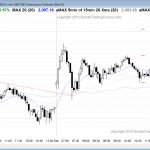
Posted at 7:19 a.m. The Emini had a trend from the open bull trend and it broke above the top of the 6 day trading range. The breakout failed and the bears completely reversed the initial rally. At the moment, the Emini is Always In Short. The reversal was strong enough so that the best […]
Intraday market update: November 30, 2015
Learn how to trade a doji candlestick pattern
Posted 7:15 a.m. The Emini sold off on the open from above Friday’s high. Friday had a small range so today could easily trade below Friday’s low and form an outside down day. The selloff had 6 bear bars and was deep enough to make a bull trend day unlikely today. Because there was a […]
Ask Al: Why institutions sell when I buy a successful breakout
Emini weekend update Q&A: November 28, 2015 Something different this time on fading breakouts. While writing the Emini Weekly Update this weekend, and with the Emini at such an interesting position going into the month end, Al wanted to address a common question on “Why would the institutions fade the bull breakouts we have seen? […]
Emini weekend update: November 28, 2015:
Weekly candlestick pattern is a major trend reversal
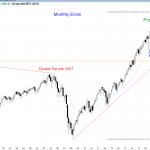
Monthly S&P500 Emini futures candlestick chart: Double top in bull trend The monthly S&P500 Emini futures candlestick chart is forming a doji candlestick pattern, and there is only one trading day left in the month. The monthly S&P500 Emini futures candlestick chart has one trading day left in the month. The candlestick pattern in November […]
Intraday market update: November 25, 2015
Learn how to trade before a holiday
Posted 7:15 a.m. After an initial selloff to the 60 minute moving average and below yesterday’s double bottom, the bulls got an opening reversal up. However, the rally stalled in the middle of yesterday’s trading range. Although the Emini is Always In Long, it is still in Breakout Mode. Traders are buying low, selling high […]
Intraday market update: November 24, 2015
Learn how to trade a catalyst
Posted 7:11 a.m. Like yesterday, today began with a trend from the open bull trend, and like yesterday, it stalled after a few bars. The initial bull breakout can lead to a measured move up or down. If the move does not begin for 10 or more bars, the initial rally will lose influence and […]
Intraday market update: November 23, 2015
Learn how to trade a breakout attempt
Posted 7:07 a.m. Today began with reversals around yesterday’s close and in the middle of yesterday’s trading range. This is a limit order open and it increases the chances of another trading range day. Three of the past 4 days have been dojis. There have been no pullbacks and the Emini is near the top […]

