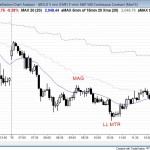
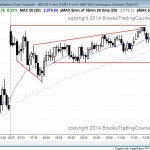
Posted 7:10 a.m. The Emini had a big gap up, but then had an opening reversal down from the 15 minute moving average. It also formed a double top with the final lower high of yesterday. At the moment, it is always in short and it might test yesterday’s low, or even break below yesterday’s […]
Intraday market update, January 2, 2015:
Intraday market update, December 31, 2014:
pullback in the 60 minute bull trend
Published 7:15 a.m. PST The Emini began with a trading range open, as expected. Day traders will look to scalp until there is a strong breakout with follow-through in either direction. If there is, they will then swing trade part of their position. Scalpers will probably have to enter mostly with limit orders and use […]
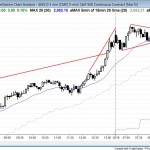
Intraday market update, December 30, 2014:
double top trend reversal
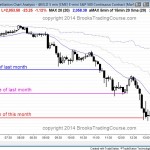
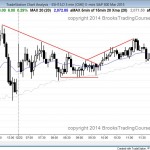
Posted 7:15 a.m. Today is the next to the last full day of trading of 2014. The Emini gapped below yesterday’s low, which is the neckline for the double top of the past two days. It reversed up, but the reversal was weak, as expected in holiday trading. The Emini then reversed down after the […]
Intraday market update, December 29, 2014:
Gap down in a bull trend
Posted 6:50 a.m. The Emini opened with 4 consecutive bull bars and is always in long at the moment. The bears want a lower high major trend reversal. If the Emini goes above Friday’s all-time high, they want an expanding triangle top. The bulls want a trend from the first bar bull trend day and […]
Emini weekend update: December 27, 2014:
The breakout to a new all time high on the daily chart has been weak.

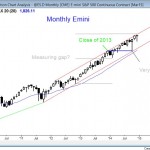
Monthly S&P500 Emini candle chart: Strong bull trend and no sign of a top The monthly Emini candle chart is in a strong bull trend, but it is testing the top of a bull trend channel. The monthly S&P500 Emini chart is in a strong bull trend, but it is overbought and at the top […]
Intraday market update, December 23, 2014:
failed breakout to a new all time high
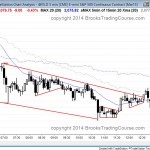
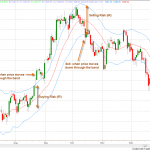
Posted 6:50 a.m. The Emini gapped up, but the first bar was a bear reversal bar and the 5 and 60 minute charts are overbought. This is a possible failed breakout to a new all time high. The bulls want the gap to stay open and become a measuring gap, and the bears want it […]
Intraday market update, December 22, 2014:
strong breakouts will probably be rare
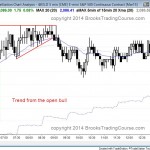
Posted 7:10 a.m. Yesterday ended with a reversal down after 3 days without much pulling back. The 5 minute chart is overbought, but can get move overbought before it evolves into a trading range. A failed breakout above yesterday’s high would create an expanding triangle top with the final hour of yesterday and a large […]
Why band trading works: Part 4
Band based trading systems
This is the last article in a four part series on band trading. In the previous articles, we reviewed the importance of trends for bands and a few types of price bands. In this article, we will study some guidelines for band based trading systems which, regardless of the band type, are limited and similar. […]
Emini weekend update: December 20, 2014:
Bull trend reversal after a breakout pullback on the daily chart
Monthly S&P500 Emini candle chart: Doji outside bar The monthly Emini candle closes in two weeks, and it is currently an outside doji candle that is testing the top of the bull trend channel. The monthly S&P500 Emini chart continues to be overbought and it is at the top of the bull trend channel, but […]
Intraday market update, December 19, 2014:
double top on the daily candle chart
Posted 7:05 a.m. Yesterday ended with consecutive buy climaxes above a bull channel, and today opened with a big bear reversal bar that was far above the moving average and the top of the channel. This was a reasonable short for a test down to the bottom of the channel, but with yesterday’s rally being […]

