Market Overview: S&P 500 Emini Futures The Emini stalled around the all-time high by closing as an outside bear doji. The bulls want a strong breakout into a new all-time high territory, hoping that it will lead to many months of sideways to up trading. The bears hope to get a TBTL (Ten Bars, Two […]
Crude Oil Pullback Phase
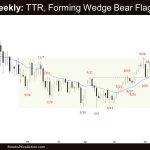
Market Overview: Crude Oil Futures The weekly chart is in the Crude Oil pullback phase which has lasted 10 weeks so far. The bulls need to create sustained follow-through buying above the 20-day EMA and the bear trend line to increase the odds of the bull leg beginning. The bears see the recent sideways to […]
EURUSD Outside Doji
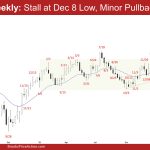
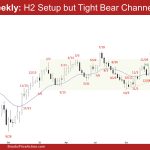
Market Overview: EURUSD Forex The weekly candlestick was a EURUSD outside doji, stalling around the December 8 low area. The bulls want a reversal from a double bottom bull flag (Dec 8 and Feb 14). The bears want the 20-week EMA to act as resistance followed by at least a small leg sideways to down […]
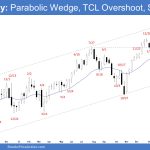
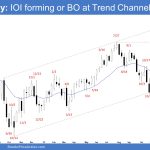
Emini Parabolic Wedge
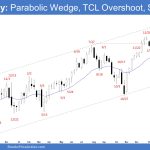
Market Overview: S&P 500 Emini Futures The weekly chart is in a tight bull channel which means strong bull, but it is also forming an Emini parabolic wedge (Nov 22, Dec 28, and Feb 9). The bulls need to continue creating follow-through buying above the all-time high. The bears want a reversal from a double […]
Crude Oil Overlapping Candlesticks
Market Overview: Crude Oil Futures Traders see Crude Oil Overlapping Candlesticks on the weekly chart which means the market is forming a tight trading range. The bulls will need to create sustained follow-through buying above the 20-day EMA and the bear trend line to increase the odds of the bull leg beginning. If the market […]
EURUSD Weak High 2 Setup
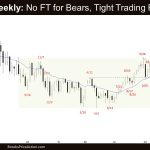
Market Overview: EURUSD Forex The weekly chart formed a EURUSD weak High 2 setup because it is following a tight bear channel. The bulls want a reversal from a double bottom bull flag (Dec 8 and Feb 6). The bears want a retest of the Feb 6 low followed by a breakout below. EURUSD Forex […]
EURUSD Trading Range
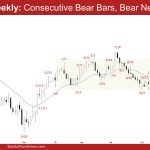
Market Overview: EURUSD Forex The monthly chart formed a EURUSD trading range closing as an inside bear bar. The bears need to create a follow-through bear bar closing below the 20-month EMA to increase the odds of reaching the October low. The bulls want the 20-month EMA to act as support. EURUSD Forex market The […]
Crude Oil Trading Range
Market Overview: Crude Oil Futures The monthly chart is forming a Crude Oil trading range. The bulls want a reversal from a higher low major trend reversal and a double bottom bull flag (May 4 and Dec 13). The bears see January simply as a pullback and want a second leg sideways to down. They […]
Emini Test All-Time High
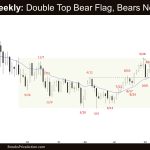
Market Overview: S&P 500 Emini Futures The monthly chart is forming an Emini test all-time high. The bulls hope that the market will reach the all-time high and break out above. The bears want a reversal from a lower high major trend reversal or a double top and a large wedge pattern (Dec 2, July […]
Crude Oil Strong Bull Bar
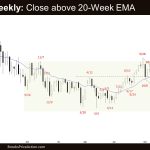
Market Overview: Crude Oil Futures The weekly chart formed a Crude Oil strong bull bar closing above the 20-week EMA. The bulls need to get a follow-through bull bar to increase the odds of the bull leg beginning. The bears see the current move simply as a two-legged pullback and want the 20-week EMA and […]