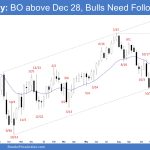
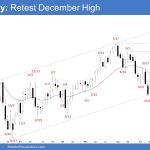
Market Overview: S&P 500 Emini Futures The weekly chart: The Emini breakout above the Dec 28 high and the bulls need follow-through buying to increase the odds of a retest of the all-time high. The bears want the Emini to stall around the December 28 high area or the trend channel line area. S&P500 Emini […]
EURUSD Stall at the 20-Day EMA
Market Overview: EURUSD Forex The pullback in the EURUSD stall at the 20-day EMA on the daily chart. The bears want a reversal from a small double top bear flag. The bulls want the 20-day EMA and the bull trend line to act as support and resume the bull leg higher. EURUSD Forex market The […]
Crude Oil Sideways Pullback
Market Overview: Crude Oil Futures The weekly chart is forming a Crude Oil sideways pullback below the 20-week EMA and the bear trend line. The bears want another leg down from a double top bear flag. The bulls will need to create follow-through buying trading above the 20-week EMA to increase the odds of higher […]
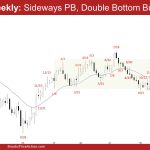
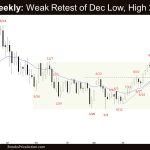
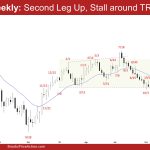
Emini Retested the December High
Market Overview: S&P 500 Emini Futures The S&P 500 Emini retested the December high following a 1 bar pullback on the weekly chart. The bulls want a breakout above the December 28 high and retest the all-time high. The bears want the market to stall around the December high area and form a Low 2 sell setup. […]
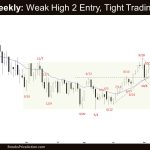
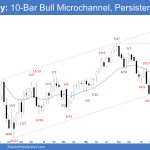
Emini Start of Pullback
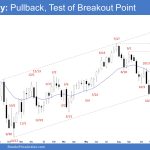
Market Overview: S&P 500 Emini Futures The market formed an Emini start of PB (pullback) following a climactic rally, ending the 10-bar bull microchannel streak. The bulls want the pullback to be sideways and shallow (with doji(s), bull bars and overlapping candlesticks), possibly forming a double bottom bull flag. The bears will need to create […]
Crude Oil Sideways to Up
Market Overview: Crude Oil Futures The market is forming a Crude Oil sideways to up pullback on the weekly chart. The bulls will need to create follow-through buying trading above the 20-week EMA to increase the odds of higher prices. The bears want the 20-week EMA and the bear trend line to act as resistance, forming […]
EURUSD Minor Pullback
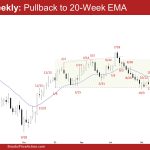
Market Overview: EURUSD Forex The weekly chart formed an EURUSD minor PB (pullback) to the 20-week EMA. The bulls want the 20-week EMA to act as support, followed by a reversal from a double bottom bull flag with the first leg being the December 8 low. The bears need to create a few strong consecutive […]
Emini Strong Consecutive Bull Bars
Market Overview: S&P 500 Emini Futures The monthly chart formed an Emini strong consecutive bull bars closing above the July 27 high. The next target for the bulls is the all-time high. They will need to create a follow-through bull bar in January to increase the odds of a breakout above the all-time high. The […]
EURUSD Bad Follow-through
Market Overview: EURUSD Forex The weekly chart formed a bear doji closing near its low therefore was an EURUSD bad follow-through candlestick. If a pullback begins, the bulls want the 20-week EMA to act as support, followed by a reversal from a double bottom bull flag. The bears want a reversal from a wedge bear […]
Crude Oil Retest Dec Low
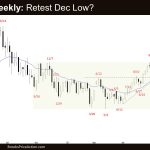
Market Overview: Crude Oil Futures The weekly chart is forming a Crude Oil retest Dec low following a minor pullback. The bears want another leg down retesting the prior leg low (Dec 13). The bulls want a reversal from a higher low major trend reversal and a wedge bull flag (Oct 6, Nov 16, and […]