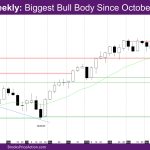
Market Overview: NASDAQ 100 Emini Futures The NASDAQ Emini futures week is a big bull trend bar closing near its high. It is another new all-time high close above June 3 high. It is also the biggest bull body since October. On the daily chart, there is a 4-bar bull micro-channel as the low of […]
DAX 40 Weekly: Failed Bull Breakout, Test Last Leg, WT
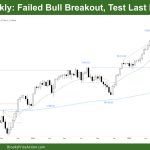
Market Overview: DAX 40 Futures DAX futures went lower last week with a failed bull breakout, pulling back to the MA after three legs up. It was a double top, and we will likely form a trading range up here between 18000 and 19000. The bulls want a double bottom test of the high and […]
FTSE 100 Second Leg Down, Test Breakout Point
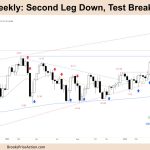
Market Overview: FTSE 100 Futures FTSE 100 futures went lower last week, with a second leg down in a strong pullback from the ATH. We are always in short on the daily chart, which is likely to become a bull flag on this chart. But it’s disappointing for the bulls, who should not have let […]
Emini Reversal below 5,400 Likely
Trading Update: Friday June 14, 2024 S&P Emini pre-open market analysis Emini daily chart Emini 5-minute chart and what to expect today Yesterday’s Emini setups Al created the SP500 Emini charts. Here are reasonable stop entry setups from yesterday. I show each buy entry bar with a green arrow and each sell entry bar with […]
Trading Update: Thursday June 13, 2024
Apologies for missing pre-market report today. Internet connection down for several hours. Below are Al’s charts for End of Day summary and yesterday’s setups. Summary of today’s S&P Emini price action Yesterday’s Emini setups Al created the SP500 Emini charts. Here are reasonable stop entry setups from yesterday. I show each buy entry bar with […]
Emini Testing 5,400
Trading Update: Wednesday June 12, 2024 S&P Emini pre-open market analysis Emini daily chart Emini 5-minute chart and what to expect today Yesterday’s Emini setups Al created the SP500 Emini charts. Here are reasonable stop entry setups from yesterday. I show each buy entry bar with a green arrow and each sell entry bar with […]
Emini Tight Trading Range, Breakout Mode
Trading Update: Tuesday June 11, 2024 S&P Emini pre-open market analysis Emini daily chart Emini 5-minute chart and what to expect today Yesterday’s Emini setups Al created the SP500 Emini charts. Here are reasonable stop entry setups from yesterday. I show each buy entry bar with a green arrow and each sell entry bar with […]
Emini Disappointing Follow-through
Trading Update: Monday June 3, 2024 S&P Emini pre-open market analysis Emini daily chart Emini 5-minute chart and what to expect today Friday’s Emini setups Al created the SP500 Emini charts. Here are reasonable stop entry setups from Friday. I show each buy entry bar with a green arrow and each sell entry bar with […]
Bitcoin breakout mode pattern on the daily chart
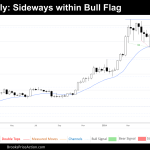
Market Overview: Bitcoin Bitcoin price action is at a crossroads, with both weekly and daily charts revealing intriguing patterns that hint at potential volatility ahead. The weekly chart showcases a market in a period of consolidation, following a strong bullish trend. A bull flag pattern has emerged, suggesting a potential continuation of the uptrend. However, […]
Weekly EURUSD Double Top Bear Flag
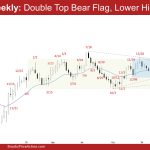
Market Overview: EURUSD Forex The market formed a weekly EURUSD double top bear flag (Apr 9 and May 16). The bears want a reversal from a double top bear flag and a small double top (May 16 and Jun 4). If there is a deeper pullback, the bulls want a reversal from a higher low major trend […]

