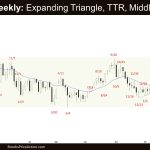
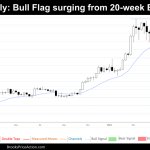
Market Overview: Crude Oil Futures The market formed a weekly Crude Oil tight trading range in the form of 4 overlapping candlesticks. The bears see the tight trading range simply as a sideways pullback and want another strong leg down. The bulls want the 20-week EMA or the bull trend line to act as support. […]
Emini Buyers below the First Pullback
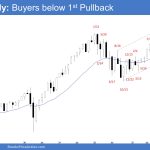
Market Overview: S&P 500 Emini Futures There were Emini buyers below the first pullback on the monthly chart. The bulls hope to get another strong leg up completing the wedge pattern with the first two legs being July 27 and March 21. The bears want a reversal from a higher high major trend reversal and a large wedge pattern (Dec 2, July 27, and March 21). S&P500 […]
Nasdaq 100 New High Close Just below April Month High
Market Overview: Nasdaq 100 Futures The NASDAQ Emini futures May monthly candlestick is a big bull bar with a prominent tail above. It is a new high close just below April month high. The week is a bear bar with a long tail below. The last two weeks’ reports had made the case that at least […]
Emini Bears Want 2nd Leg Down
Trading Update: Friday May 31, 2024 S&P Emini pre-open market analysis Emini daily chart Emini 5-minute chart and what to expect today Yesterday’s Emini setups Al created the SP500 Emini charts. Here are reasonable stop entry setups from yesterday. I show each buy entry bar with a green arrow and each sell entry bar with […]
Bitcoin insists on continuing the trend by testing $70000
Market Overview: Bitcoin Bitcoin’s weekly chart hints at a potential resumption of the bullish trend, a critical question emerges: What hurdles must the bulls overcome to maintain their momentum? Conversely, how can the bears seize control and reverse the tide? Our analysis delves into these questions, examining the intricate dance between buyers and sellers. On […]
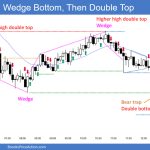
No Weekly EURUSD Follow-through
Market Overview: EURUSD Forex There was no weekly EURUSD follow-through bull bar following last week’s close above the 20-week EMA. The bulls need to create follow-through buying trading above the 20-week EMA to increase the odds of retesting the December high. The bears see the recent moves simply as a deep pullback and want at least a small […]
Crude Oil OO Pattern
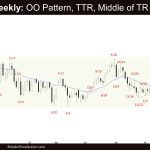
Market Overview: Crude Oil Futures The weekly chart formed a Crude Oil OO pattern (outside-outside) which means the market is in breakout mode. Crude Oil is currently trading around the middle of the large trading range, which is an area of balance. The overlapping price action in the last 3 weeks also indicates that the market is in a tight trading range. Crude oil futures The […]
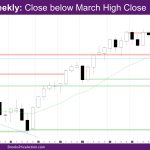
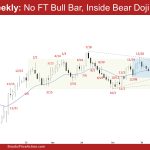
No Weekly Emini Follow-through
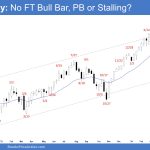
Market Overview: S&P 500 Emini Futures There was no weekly Emini follow-through buying following last week’s breakout above the March 21 high. The bulls see this week simply as a pullback and want the market to continue higher. The bears want a reversal from a higher high major trend reversal or a double top with the March 21 high. […]
Nifty 50 Bull Breakout
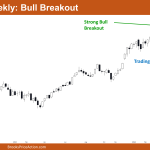
Market Overview: Nifty 50 Futures Nifty 50 Bull Breakout on the weekly chart. The market on the weekly chart formed a strong consecutive bull bar this week, resulting in a robust bull breakout of the trading range. This indicates a measured move up based on the height of the trading range. Bears need at least […]
Nasdaq 100 CC Bull Close above March High Close
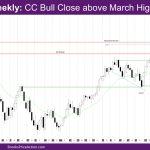
Market Overview: NASDAQ 100 Emini Futures The NASDAQ Emini futures week is a bull bar with a prominent tail above. The market had a CC bull close above March high close and a new all-time high close. Note: CC is an abbreviation for consecutive. On the daily chart, this week was the channel phase of […]

