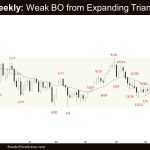
Market Overview: Crude Oil Futures The weekly chart formed a weak Crude Oil breakout from the small expanding triangle. The bulls want the 20-week EMA or the bull trend line to act as support. They want a failed breakout below the bull trend line. The bears need to create follow-through selling trading far below the […]
Weekly Emini Higher High MTR
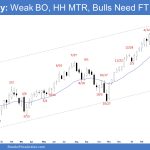
Market Overview: S&P 500 Emini Futures The market formed a weekly Emini higher high MTR (major trend reversal) pattern. The bulls need to create a follow-through bull bar to confirm the breakout above the all-time high, even if it is only a bull doji. The bears need to create a few strong bear bars to increase the […]
Nasdaq 100 New All-Time High Close above May 27 High
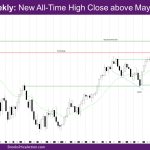
Market Overview: NASDAQ 100 Emini Futures The NASDAQ Emini futures week is a bull trend bar with a prominent tail above and below. The market had a new all-time high close above May 27 high. Also, the bull body gap with the March high close is still open. On the daily chart, Wednesday was a […]
Nifty 50 Wedge Overshoot
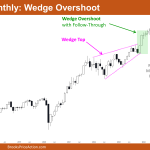
Market Overview: Nifty 50 Futures Nifty 50 Wedge Overshoot on the monthly chart. The market on the monthly chart (May month bar) gave a doji close. Bulls were able to follow through well after the wedge overshoot and are still continuing that bull leg. The weekly chart shows a very big outside bar that covered […]
DAX 40 Tight Bull Channel, Failed Breakout, Pause
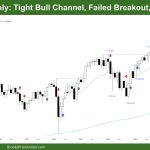
Market Overview: DAX 40 Futures DAX futures rose last month with a potential failed breakout in a bull channel. A likely parabolic wedge top, a stronger breakout on a higher time frame, and traders wonder how much of the breakout gap will stay open. Bulls are sitting on good profits, but bears haven’t triggered a […]
FTSE 100 ATH, Bull Channel, Sideways Expected
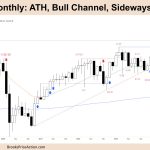
Market Overview: FTSE 100 Futures FTSE 100 futures moved higher last month in a bull channel, but the bar had a big tail. Who is selling? Bulls are taking profits after a strong breakout. Bears want to close the breakout gap, and bulls want a pullback to buy again. We have been in a trading […]
Emini Sideways Likely for Bears
Trading Update: Friday June 7, 2024 S&P Emini pre-open market analysis Emini daily chart Emini 5-minute chart and what to expect today Summary of today’s S&P Emini price action Al created the SP500 Emini charts. See the weekly update for a discussion of the price action on the weekly chart and for what to expect […]
Emini Bulls Hopeful for 2nd Leg Up
Trading Update: Thursday June 6, 2024 S&P Emini pre-open market analysis Emini daily chart Emini 5-minute chart and what to expect today Summary of today’s S&P Emini price action Al created the SP500 Emini charts. End of day video review Live stream videos to follow Monday, Wednesday and Friday (subject to change). See the weekly […]
Bitcoin monthly bulls limiting downside risk
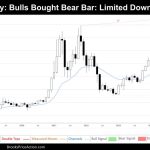
Market Overview: Bitcoin Bitcoin‘s May bullish candle, emerging after April’s retracement, reaffirms the resilience of the upward trend despite earlier failures to surpass all-time highs. However, the long upper wick of the May candle reveals a rejection of higher prices near the March close, suggesting a potential struggle for bulls to maintain control at elevated […]
EURUSD Triangle
Market Overview: EURUSD Forex The monthly chart formed a EURUSD triangle. The bulls need to create a follow-through bull bar in June to increase the odds of higher prices. If the market trades higher, the bears want a reversal from a double top bear flag with the March 8 high. EURUSD The Monthly EURUSD Forex […]

